 By ByteBot
Grafana 13 shipped April 21 at GrafanaCON 2026 in Barcelona, and the headline isn’t dashboards. It’s the GCX CLI, which auto-detects Claude Code and Cursor sessions and pulls live metrics, traces, and SLO data into your terminal mid-debugging. The tool that made observability mainstream is now trying to become part of the development loop itself — not just the place you check after the incident.
Loki Gets Kafka: The Storage Tax Is Gone
The old Loki ingestion model had a quiet waste problem. Three-way replication was the design intent, but time sync drift between ingesters meant deduplication by filename broke down in practice. The actual storage overhead: 2.3x per log line, not 3x. “We end up storing on average 2.3x, for every log line that we ingest, we store it 2.3 times,” said Trevor Whitney, staff software engineer at Grafana Labs.
The fix is a Kafka-backed ingestion layer. Logs land in Kafka once. Ingesters pull from the queue. Effective replication drops to 1x. The redesigned query engine distributes work across partitions and executes in parallel, delivering up to 20x less data scanned and 10x faster aggregated query performance.
The trade-off is real: distributed Loki deployments now require Kafka. Loki’s original appeal was minimal dependencies — just object storage. That promise is gone for distributed installs. Single-binary deployments are unaffected, but teams running Loki at scale should plan a migration. Grafana also acquired Logline, a log search specialist, to improve full-text search precision in the new architecture.
GCX CLI: Observability Meets Your Coding Agent
GCX is Grafana Cloud’s new CLI and the most interesting thing in this release. It’s built for both human and agent use: auto-detects when Claude Code or Cursor is driving the session, strips human-friendly UI noise (spinners, truncation), and exposes everything via stable JSON/YAML output with consistent exit codes that agents can rely on.
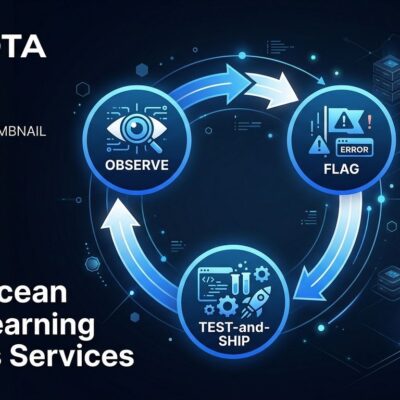
The intended workflow: synthetic monitoring fires, Grafana Assistant runs root cause analysis, GCX pulls that analysis into the coding session, the agent proposes a fix, and GCX queries live metrics to confirm recovery. Agent skills for alert investigation, SLO management, and observability setup can be installed in one command:
gcx skills install --allGCX handles the full observability setup loop — wiring OpenTelemetry into codebases from the terminal, generating alert rules from actual service signals, pulling dashboards and alerts as editable files for GitOps workflows. Force agent mode explicitly with GCX_AGENT_MODE=true if auto-detection doesn’t fire. GCX is currently in public preview. Grafana is also building a remote MCP server in parallel, recognizing that CLI and MCP serve different audiences.
k6 2.0: Load Testing Gets an MCP Server
k6 2.0 ships four new AI-integrated subcommands. The one worth noting: k6 x mcp — a built-in Model Context Protocol server that lets coding agents write tests, run them, and inspect results inside the session without switching tools. k6 x agent bootstraps agentic test-writing, configures the environment, and points the agent at best-practice resources.
Beyond the AI layer, 2.0 brings a new Assertions API (expect()) with two modes — non-retrying for static values like HTTP status codes and headers, auto-retrying for browser elements. The distinction matters: assertions halt the test on failure, while checks continue. That changes CI pipeline behavior and is worth understanding before upgrading.
The browser module now aligns much more closely with Playwright, making migration from existing Playwright test suites more practical. The k6 Operator reaches v1.0 — the Kubernetes operator for distributed load testing is now stable. Native OpenTelemetry output also ships, enabling real-time analysis alongside application telemetry.
Git Sync Is Now GA: Observability as Code
Git Sync moves to generally available across all Grafana editions — OSS, Enterprise, and Cloud. Teams can now version-control their entire Grafana configuration (dashboards, alerts, data sources) via GitHub, GitLab, or Bitbucket with bidirectional sync and GitHub App authentication. According to Grafana’s 2026 Observability Survey, 77% of organizations rely on open source for observability, but 38% still cite complexity as their top challenge. Git Sync is the most direct answer: treat your observability stack like application code and get the audit trail, rollback, and PR review process that comes with it.
Teams who upgraded before April 16 should check the Grafana 13 release notes for a documented Git Sync edge case in that window.
The Bigger Picture
The through-line across Grafana 13 is clear: Grafana Labs is building observability into the agentic development loop, not just providing tools for humans to monitor production. GCX in Claude Code, k6’s MCP server, and the new AI Observability product (public preview in Grafana Cloud, monitoring LLM agent inputs and outputs in production) all point the same direction.
This is a meaningful platform shift. If the GCX loop — detect issue, analyze, fix, verify — works reliably in practice, it changes what on-call looks like for teams using AI coding agents. Whether that vision delivers at public preview quality is the question to watch.
Full release details are in the Grafana 13 release blog. The GrafanaCON 2026 announcements page covers Pyroscope 2.0 and other releases from the same event.