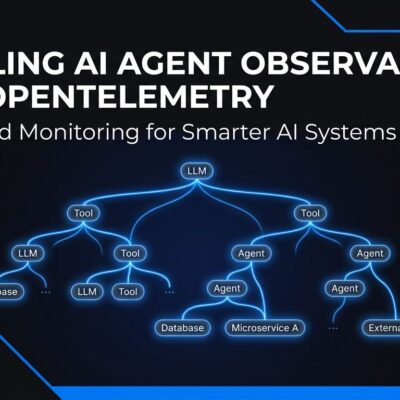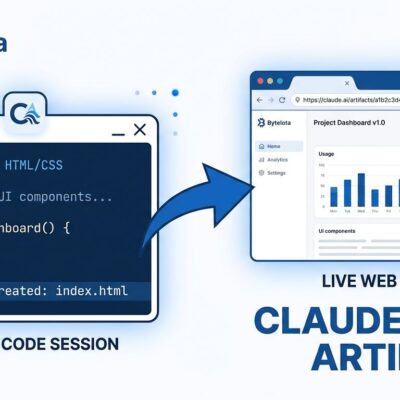
Chrome DevTools MCP is a Model Context Protocol server launched by Google’s Chrome DevTools team in 2026 that solves a fundamental problem for AI coding agents: they can’t see what their generated code actually does in the browser. By connecting AI assistants like Claude Code, Cursor, and Gemini directly to Chrome DevTools, this tool gives agents the ability to debug web applications autonomously—running performance traces, analyzing network requests, and inspecting console errors with the same depth as human developers. With 35,975 GitHub stars and 29 tools spanning debugging, performance profiling, and automation, it eliminates the frustrating back-and-forth of “AI generates code, human tests, human reports errors, AI tries again” by letting agents directly inspect browser state.
What Chrome DevTools MCP Actually Does
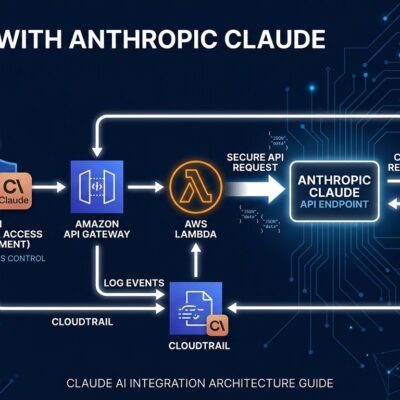
Chrome DevTools MCP exposes 29 tools across 6 categories: input automation (click, fill forms, upload files), navigation (open pages, switch tabs), emulation (test mobile devices, throttle network), performance profiling (run traces, capture memory snapshots), network debugging (inspect API calls, check headers), and DevTools debugging (read console errors, run Lighthouse audits, take screenshots). It implements the Model Context Protocol (open standard by Anthropic, now Linux Foundation) to bridge AI assistants and Chrome’s Developer Tools via the Chrome DevTools Protocol.
The psychological shift is significant. Before this, AI agents generated code without seeing results—they’d suggest CSS fixes without knowing what the page looked like, or optimize JavaScript without seeing network waterfalls. Chrome DevTools MCP changes the workflow from “generate and hope” to “observe, analyze, fix.” Agents become debugging partners, not just code generators.
Three features stand out: source-mapped stack traces (console errors map to original TypeScript/JSX files, not minified bundles), Lighthouse integration (full automated audits for performance, accessibility, SEO), and CrUX API integration (real-user performance data from Chrome’s field database). These aren’t novelties—they’re the exact capabilities developers use in DevTools every day, now accessible to AI agents.
Installation Takes 2 Minutes
Setting up Chrome DevTools MCP requires adding a JSON configuration to your AI assistant’s MCP settings. Here’s the minimal working config:
{
  "mcpServers": {
    "chrome-devtools": {
      "command": "npx",
      "args": ["-y", "chrome-devtools-mcp@latest"]
    }
  }
}
The installation uses npx to run the latest version without requiring permanent installation. After adding this config and restarting your AI assistant, agents automatically have access to all 29 tools—no additional setup needed.
Installation commands by platform: Claude Code users run claude mcp add chrome-devtools npx chrome-devtools-mcp@latest in terminal. Cursor users go to Settings → MCP → New MCP Server and paste the JSON. Gemini CLI users run droid mcp add chrome-devtools "npx -y chrome-devtools-mcp@latest". That’s it. The GitHub repository has detailed setup guides for each platform.
Configuration options exist for specific use cases: --slim reduces from 29 tools to 3 (cuts token cost from 18k to 6k), --browserUrl http://localhost:9222 connects to a running Chrome instance instead of spawning a new one, --headless runs Chrome without UI (useful for CI/CD), and --no-performance-crux disables Google CrUX API calls for privacy-sensitive staging environments.
Real-World Debugging Scenarios
Chrome DevTools MCP excels in three workflows: performance optimization, network debugging, and console error diagnosis. In each case, the agent sees the same data developers see in DevTools—but analyzes patterns faster and suggests fixes without context switching.
Performance optimization example: Prompt your AI assistant with “Check the LCP of https://example.com” and the agent runs performance_start_trace, loads the site, records a 5-second trace, then analyzes it. If it finds an oversized 2.4MB hero image causing a 4.2-second Largest Contentful Paint (failing the “Good” threshold of 2.5s), it suggests compressing to WebP (saves 80%), adding lazy loading for below-fold images, and preloading critical assets. Implement those changes and LCP drops to 1.8 seconds.
Network debugging example: When API calls fail in localhost development, highlight the failing request in DevTools Network panel and prompt “Investigate this failing request.” The agent reads the request via MCP, checks status (500), headers (missing CORS), and timing (5-second timeout). It identifies the issue—backend missing Access-Control-Allow-Origin header—and suggests adding CORS middleware and increasing timeout from 5s to 10s for slow endpoints.
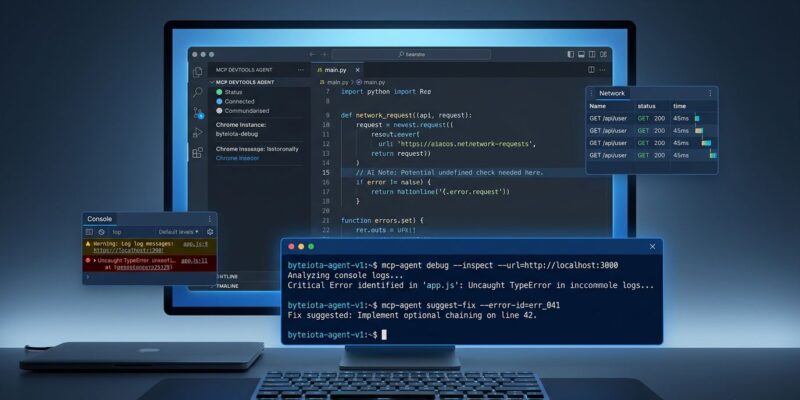
Console error diagnosis example: Prompt “Open localhost:3000 and summarize console errors” and the agent navigates, waits for page load, calls list_console_messages(), then finds 2 errors with source maps: “Failed to fetch /api/users” (network.js:42) and “Deprecated componentWillMount” (Component.jsx:15). It maps errors to original source files (not minified bundles) and suggests checking CORS in network.js and updating Component.jsx to use the useEffect hook. The DebugBear performance guide walks through additional real-world debugging workflows.
Trade-offs You Should Know About
Chrome DevTools MCP isn’t perfect. Three limitations matter: token cost, Chrome-only support, and security considerations.
Token cost is high. Full mode uses 18,000 tokens (9% of a 200k context window) before the agent writes a line of code. A Hacker News developer put it bluntly: “Before your agent does anything, 9% of your context is gone. That’s a problem when you’re combining multiple MCP servers.” Slim mode reduces this to 6,000 tokens (3% of context) by loading only 3 basic tools—navigate, screenshot, console—instead of all 29. For comparison, Playwright MCP uses 13,700 tokens and Vercel’s agent-browser uses zero tokens (it’s a CLI tool, not an MCP server).
Chrome-only support is a real limitation. No official support for Firefox, Safari, or Edge exists. Cross-browser testing requires Playwright MCP or alternatives. Community projects like Safari MCP exist (40-60% less CPU on Apple Silicon), but the official Chrome DevTools team only supports Chrome.
Security considerations aren’t hypothetical. Chrome DevTools MCP exposes browser content to the MCP client (don’t connect to sessions with sensitive data) and performance traces send URLs to Google’s CrUX API by default for real-user data comparison. Add --no-performance-crux flag for internal or staging sites to prevent data leakage. The official Chrome for Developers blog documents these security implications.
When to Use This vs Alternatives
Use Chrome DevTools MCP for development debugging and performance profiling—LCP analysis, Lighthouse audits, console inspection. Use Playwright MCP for cross-browser E2E testing. Use agent-browser (Vercel) for production monitoring and automated testing at scale. Use direct Puppeteer/Playwright for programmatic automation without AI. The best teams use multiple tools: DevTools MCP during development, agent-browser for CI/CD pipelines, and RUM tools (Sentry, Datadog) for production monitoring.
Don’t use Chrome DevTools MCP for cross-browser testing (it’s Chrome-only), production user monitoring (use real-user monitoring tools instead), or high-scale automation (token costs add up fast). The DevTools MCP vs agent-browser comparison breaks down when to use each tool based on use case.
The decision matrix is straightforward: Chrome-specific debugging needs DevTools MCP, cross-browser needs Playwright, token-constrained scenarios need agent-browser or slim mode. Understanding these boundaries prevents wrong tool selection and wasted debugging time.
Key Takeaways
Chrome DevTools MCP gives AI coding assistants real-time browser visibility through 29 tools spanning debugging, performance profiling, and automation. Setup takes 2 minutes: add a JSON config to your AI assistant’s MCP settings, restart, and start debugging. It’s best suited for development debugging and performance profiling, not cross-browser testing or production monitoring. Use slim mode (6,000 tokens instead of 18,000) when combining multiple MCP servers to avoid context window bloat. Test it with “Check the LCP of web.dev” to see performance analysis in action.
The broader significance is psychological: AI agents no longer code blindly. They observe, diagnose, and suggest fixes with the same data developers see in DevTools. That shift—from “generate and hope” to “observe and assist”—makes AI coding assistants genuinely useful for debugging instead of just code generation. For developers already using Claude Code, Cursor, or Gemini, Chrome DevTools MCP is an immediate productivity enhancement with official Google backing and an active ecosystem. The DataCamp tutorial provides a step-by-step setup guide with additional examples.