 By
By Your AI agent works fine in development. In production, it occasionally hangs for 45 seconds and you have no idea why. Is it the vector retrieval? The first LLM call? A tool call hitting a rate limit downstream? Most teams in 2026 are still answering that question with print statements. That is not a great situation to be in when the agent is customer-facing.
The CNCF published a Jaeger project update on May 26 that formally addresses this gap. Jaeger v2 — already rebuilt as a native OpenTelemetry Collector distribution — is now committing to first-class AI agent observability using the OTel GenAI semantic conventions. For teams building production agentic systems, this is the moment to stop flying blind.
Why Existing Tracing Does Not Work for Agents
Traditional distributed tracing was designed for deterministic microservices. An HTTP request flows through four services, each hop creates a span, you get a clean waterfall and a root cause. AI agents break every assumption that design rests on.
An agent may invoke the same tool five times in one session and zero times in another. LLM calls are non-deterministic in duration — the same prompt can return in 300ms or 28 seconds. Reasoning loops do not map to a request/response model. Token usage drives your costs but most tracing backends have no concept of it. Without native GenAI semantics in your tracing stack, you get a giant opaque span labeled “LLM call” and no way to dig deeper.
What the OTel GenAI Conventions Actually Define
The OpenTelemetry GenAI semantic conventions standardize the attributes on spans for generative AI operations. There are three span types worth knowing.
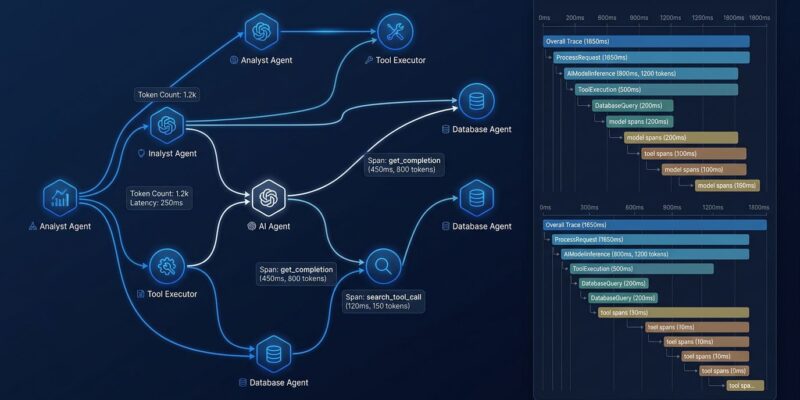
Model spans use gen_ai.operation.name = "chat" and capture the model name, input token count, output token count, finish reason, and call latency as the span duration. One model call, one span, all the data you need to understand cost and performance.
Agent spans use gen_ai.operation.name = "invoke_agent" and act as the root span for an agent invocation. The span name is invoke_agent {agent_name}. Every model call and tool call that agent makes nests underneath it as child spans, giving you the full execution tree.
Tool spans use gen_ai.operation.name = "execute_tool" and capture the tool name and its arguments — stored as span events rather than span attributes. This keeps potentially sensitive argument data out of the attribute index and lets you filter or drop it at the Collector level.
Why Jaeger v2 Is the Right Backend Here
Jaeger v2 matters for two specific reasons. First, it is built as an OpenTelemetry Collector distribution — not a separate system that ingests OTel data. There is no translation layer. Your GenAI spans land in Jaeger exactly as you emitted them, with all attributes intact. The same binary you run locally is what you run in production.
Second, the Jaeger team is building GenAI-aware visualization features. When Jaeger detects a trace with GenAI metadata, it will adapt the UI: distinct icons for LLM calls versus tool calls versus RAG retrievals, token usage surfaced alongside latency, a toggle to strip infrastructure noise and show only the agent’s reasoning flow. This is in progress and not in v2.15.0 yet — but it is being built against OTel standard conventions, which means your instrumentation stays valid.
MCP Tool Calls as First-Class Spans
The May 26 CNCF post explicitly calls out Jaeger adopting the Model Context Protocol, Agent Client Protocol (ACP), and AG-UI standard. Most production agent stacks in 2026 route tool calls through MCP servers. When your agent calls a search tool or database query via an MCP server, that call has historically been invisible to your tracing backend — it appeared as a generic HTTP request with no semantic meaning.
With Jaeger adopting MCP trace conventions, that call becomes a proper span: MCP server name, tool name, arguments, response, duration, and status. You get full attribution — which agent triggered this call, how long the MCP server took to respond, and whether it returned an error. For teams debugging agents that chain five or ten tool calls per invocation, this is the visibility that actually lets you find the bottleneck.
How to Start Today
The instrumentation libraries are available now. Install the dependencies:
pip install opentelemetry-api opentelemetry-sdk opentelemetry-exporter-otlp
pip install opentelemetry-instrumentation-openai-v2   # OpenAI and OpenAI Agents SDK
pip install opentelemetry-instrument-anthropic         # Anthropic
Configure the SDK and instrument your client:
from opentelemetry import trace
from opentelemetry.sdk.trace import TracerProvider
from opentelemetry.exporter.otlp.proto.grpc.trace_exporter import OTLPSpanExporter
from opentelemetry.sdk.trace.export import BatchSpanProcessor
from opentelemetry.instrumentation.openai import OpenAIInstrumentor

provider = TracerProvider()
provider.add_span_processor(
    BatchSpanProcessor(OTLPSpanExporter(endpoint="http://localhost:4317"))
)
trace.set_tracer_provider(provider)

OpenAIInstrumentor().instrument()
# All subsequent OpenAI API calls now emit GenAI-standard spans automatically
Run Jaeger v2 locally:
docker run -p 16686:16686 -p 4317:4317 jaegertracing/jaeger:2.17.0Open localhost:16686, run your agent, and you will see the full trace: which LLM call took 4 seconds, which tool call failed on retry two, how many tokens each step consumed.
Two Caveats Worth Knowing
The GenAI semantic conventions are still in Development status as of SemConv v1.40.0. They are stable enough to use in production today, but attribute names could change before they reach Stable. If you build automation on specific attribute names, account for that.
The specialized Jaeger GenAI UI is in progress, not shipped. Jaeger v2.15.0 handles GenAI span ingestion correctly but the token-aware visualization and agentic flow view are coming in a future release. The standard Jaeger trace view works fine in the meantime — just not optimized for agent workflows yet.
The Case for Instrumenting Now
Datadog, New Relic, and Dynatrace all natively support OTel GenAI semantic conventions today and have more mature GenAI dashboards than Jaeger does right now. If you need something polished immediately, those are valid choices.
The case for Jaeger is different: free, runs in your own infrastructure, and the instrumentation you write is OTel-standard. If you instrument your agent stack with OTel GenAI semconv today and export to Jaeger, you can switch to Datadog, Honeycomb, or any other OTel-compatible backend later without touching your application code. The standard is the asset, not the backend. That portability is worth building into your stack from day one, and Jaeger gives you a solid open-source way to do it.