 By
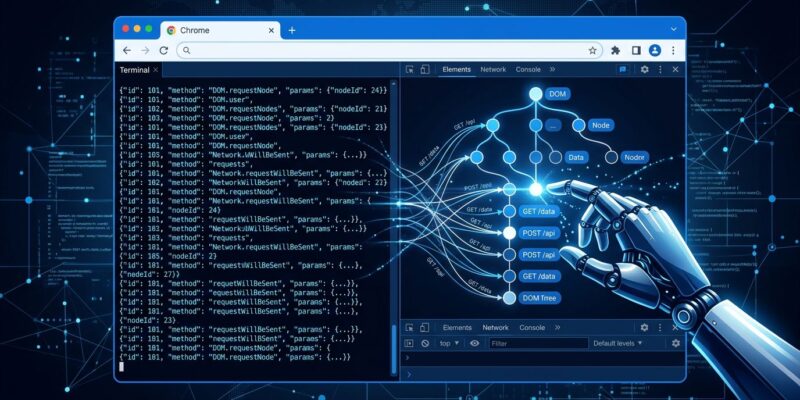
By OpenAI just gave Codex full access to Chrome’s DevTools Protocol — the same low-level interface that powers your browser’s Network tab, console, and JavaScript profiler. That means your AI coding agent can now read raw network traffic, inspect the DOM directly, catch runtime errors in real time, and profile page performance without you touching DevTools manually. The feature is called Developer mode, it shipped this week as part of a broader Codex update, and it makes browser use up to 2x faster. It is off by default. Keep reading before you enable it.
What CDP Developer Mode Actually Gives Codex
The Chrome DevTools Protocol is a JSON-RPC interface over WebSocket that gives external programs direct control over Chromium-based browsers. It is the same protocol that Playwright and Puppeteer use under the hood. Codex now speaks it natively in both Chrome and the Codex in-app browser.
With Developer mode on, Codex can access:
- Network domain — requests, responses, headers, timings, WebSocket frames, failures
- DOM domain — full node tree, computed styles, rule matches
- Console — runtime logs and errors as they occur, not after the fact
- JavaScript profiling — execution traces and performance bottlenecks
- DOMSnapshot — single-call full DOM capture that eliminates round-trip overhead
The practical difference is significant. Previously, when you asked Codex to debug a broken API call, it was essentially reading screenshots and simulating clicks. Now it can read the actual 422 response body, check what headers your frontend sent, and map the failure to a specific function in your codebase — without you manually opening DevTools and digging through the Network panel.
Why Browser Use Gets 2x Faster
The speed improvement is not just for debugging flows. CDP access changes how Codex reads any web page it browses.
Two optimizations drive the gain:
- Direct API access instead of screenshots — Codex no longer needs to screenshot a page and interpret it visually. CDP gives it structured data directly.
- DOMSnapshot eliminates round trips — Where previous Codex browser sessions required multiple DOM inspection calls, CDP’s DOMSnapshot captures the entire DOM tree in one call.
This is not a Codex-specific discovery. Stagehand v3, a competing browser automation layer that went CDP-direct, saw 44% speed improvements over screenshot-based approaches. OpenAI’s 2x figure for Codex is consistent with the broader shift away from the screenshot layer in browser agent architecture.
How to Enable Developer Mode
Three steps, in order:
- Admins enable the in-app browser in Codex organizational settings (required first)
- Users go to Settings > Browser > Developer mode and turn on Enable full CDP access
- Codex requests explicit approval before using CDP on each domain it inspects
For enterprise deployments, admins can block the feature entirely via managed configuration. Refer to the Codex in-app browser documentation for the full configuration reference.
# Managed configuration — disable CDP access org-wide
browser_use_full_cdp_access = false
If your organization has this set, users cannot override it locally.
The Security Tradeoff Nobody Is Talking About
OpenAI made the right default choices: off by default, per-site approval required, admin kill switch available. But the guidance stops short of where enterprises actually need it.
Full CDP access means Codex can read HttpOnly cookies — the cookies that JavaScript cannot touch, the ones protecting your session tokens. It can harvest OAuth access tokens from network traffic. It can read session storage and IndexedDB. If your browser is logged into your AWS console, your GitHub, or your production database admin panel when Codex browses that domain, the agent sees all of it.
OpenAI’s agent approvals and security documentation is honest about this: “Full CDP access lets Codex inspect and control sensitive browser internals that may put your data at risk.” The per-site approval model handles the obvious risk. What it does not handle: there are currently no audit logs for what Codex reads via CDP. Enterprises can see that CDP was enabled, but not what data the agent accessed during a session.
There is also a prompt injection angle. A malicious web page Codex browses can embed hidden instructions in its DOM or network responses. When Codex reads that content via CDP, those instructions arrive in structured form rather than as a screenshot — potentially making them more legible as trusted input to the model. Prompt injection via web content is an established attack vector for browser-using AI agents, and CDP access expands that surface.
When to Enable It, When to Leave It Off
Enable Developer mode for:
- Local debugging of your own web applications
- Performance profiling of a frontend you control
- Reproducing production bugs in an isolated local environment
- Generating end-to-end test cases from live browser state
Leave it off for:
- CI\/CD pipelines — until OpenAI ships CDP audit logging
- Shared development environments with multiple users
- Any workflow that touches production credentials, OAuth sessions, or auth tokens
- Browsing untrusted domains where prompt injection is a realistic concern
Developer mode is the right tool for local debugging. It is not ready to be a permanent-on setting in team environments, and it should not appear in your CI pipeline until the audit log story is complete. Enable it per-session, per-project — not globally. The 2x speed gain is real, and the CDP debugging capability is genuinely useful. But right now, you are trading visibility into what the agent accessed for the convenience of not opening DevTools yourself. Know that tradeoff before you flip the switch.