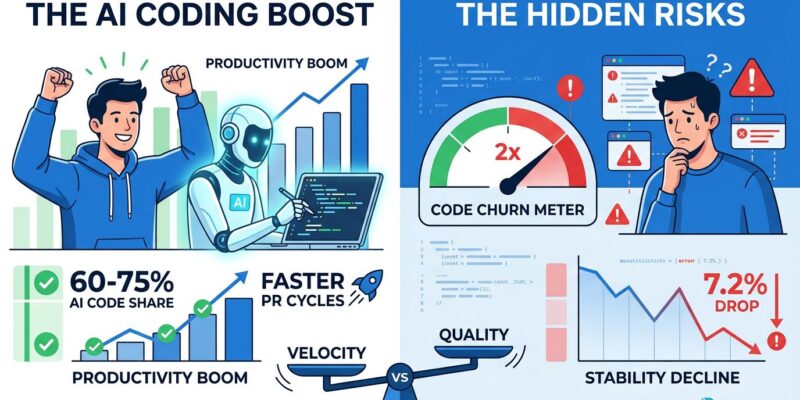
AI coding tools crossed a critical threshold in 2026: 41% of all code is now AI-generated, up from negligible two years ago. Developers report saving 30-60% of their time on routine tasks, and elite teams achieve 1.8-2.0x velocity gains according to Q1 2026 benchmarks from GetDX, Larridin, and Index.dev. But the data reveals a hidden cost: code churn doubled from 3.3% to 7.1%, delivery stability dropped 7.2% per Google’s 2024 DORA report, and AI code churns at 1.5-2.0x the human baseline. The productivity gain is real—so are the quality trade-offs.
What “Elite” AI Productivity Actually Looks Like
The Q1 2026 benchmarks define what separates winners from losers. Elite teams maintain 60-75% AI code share—far above the 15-25% industry average—while achieving sub-8-hour PR cycles and 4-6x ROI. Their secret? A single metric most teams ignore: code turnover ratio.
Elite teams keep AI-to-human code turnover below 1.3x. Average teams hit 1.5-2.0x. Problem teams exceed 2.0x—their AI code churns at double the human rate or worse. This is the line between sustainable productivity and technical debt accumulation.
Larridin’s benchmarks show elite teams measure at least three of five dimensions: adoption (80%+ weekly active usage, not seat licenses), AI code share, complexity-adjusted velocity, quality, and ROI. Teams measuring fewer than three overestimate gains by 20-40%.
The Measurement Gap: Why You Think You’re Faster Than You Are
Developers report feeling 20% faster with AI tools. Actual testing—including review and debugging time—showed they were 19% slower. Yet they still believed they were faster.
This perception gap exists because traditional metrics only measure velocity. PR throughput goes up. Lines of code skyrocket. But these speed metrics hide the quality collapse. Zylos Research recommends a counter-metrics principle: every speed metric needs a quality balance. Deployment frequency → change failure rate. Code output → code turnover. Most teams don’t. They chase velocity while accumulating hidden costs.
The Hidden Costs: Code Churn Doubles, Stability Drops
Google’s 2024 DORA report revealed the damage. Delivery stability decreased 7.2% with AI adoption. PR size increased 51%. Bugs per developer jumped 54%. Median time in PR review spiked 441% as processes buckled.
First-year costs run 12% higher than expected when factoring 9% code review overhead, 1.7x testing burden, and 2x churn requiring rewrites. Year two gets painful: unmanaged AI code drives maintenance costs to 4x as debt compounds. Forrester predicts 75% of organizations will face moderate-to-severe technical debt by end of 2026.
There’s also comprehension debt. AI generates code faster than humans can understand it. When it breaks, 45.2% report debugging AI code takes longer than debugging human code. You saved 30 minutes writing it, then spent an hour figuring out what it does.
Tool Landscape: Copilot vs Cursor
GitHub Copilot maintains 9.76% daily adoption—highest stickiness of any tool. Its inline completion model generates 3.61 PRs per day for daily users.
Cursor, with its agentic model, shows 31.56% weekly adoption and delivers 4.1 PRs per day—a 46% throughput increase in one quarter. GetDX’s analysis of 64,680 developers across 219 companies found “newer, agentic tools consistently outperform traditional solutions.” But higher throughput means teams need stronger quality gates.
The Practical Benchmark: Self-Assessment
Red flags: AI code share above 50% with turnover above 2.0x (danger zone), PR cycles exceeding 36 hours (review bottleneck), ROI below 2.0x (not worth it), innovation rate dropping despite rising velocity (creating rework, not features).
Green zone: 60-75% AI share, <1.3x turnover, sub-8-hour PRs, ROI >2.5x, >80% weekly active usage, innovation rate >50%. Elite teams hit these by measuring quality as rigorously as velocity.
Winners invest in review processes for 51% larger PRs, track all five pillars monthly, and balance AI speed with human oversight. Losers assume adoption equals productivity, skip quality gates to “move fast,” and measure only seat licenses.
What This Means
AI code share is headed to 65% by 2027. The industry is bifurcating: elite teams that measure quality, and struggling teams chasing speed while accumulating debt.
The technical debt crisis is coming. Teams optimizing for velocity without quality metrics are building a time bomb. First-year costs creep up 12%. Year-two maintenance explodes to 4x. By year three, you’re spending more time fixing AI code than building features.
The teams that win don’t reject AI tools—the gains are real. But they don’t buy the “10x faster” hype either. They measure what matters: not just how much code you write, but how much survives 30 days without rewrites. Not just how fast you ship, but whether stability holds. Not just adoption rates, but ROI including token costs and review overhead.
The Q1 2026 benchmarks handed you a roadmap. Elite teams cracked the code: high AI adoption with quality gates that prevent churn explosion. Everyone else is about to find out what 4x maintenance costs feel like.