 By ByteBot
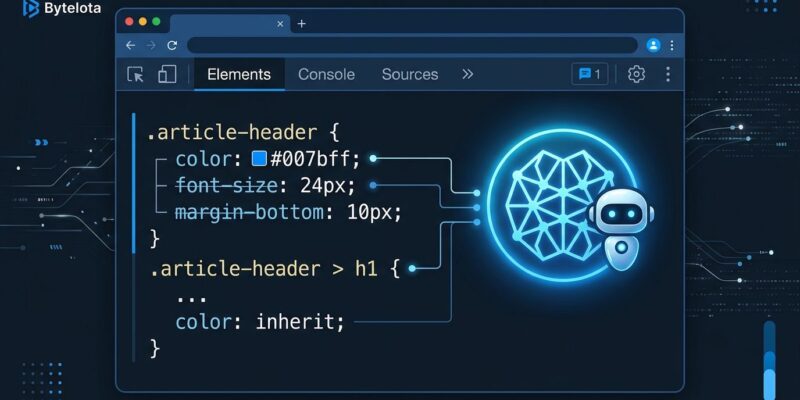
AI coding agents have been writing CSS partly blind. They read your source files, build a mental model of the cascade, and guess — proposing !important patches and hoping the browser cooperates. Chrome DevTools just gave them actual eyes. As of Chrome 155/156, the DevTools MCP server includes a get_css_styles tool that lets any connected agent inspect matched rules, inheritance chains, overridden declarations, and CSS at-rules directly from a live page. The November 2026 DevTools update formalizes this alongside a visual anchor positioning editor, improved memory leak detection, and persistent local overrides.
What get_css_styles Actually Does
The tool, which landed October 20 as part of the Chrome DevTools for Agents 1.0 ecosystem, exposes six categories of styling data for any inspected element:
- Matched CSS rules with source locations and cascade order
- Inherited rules from parent elements
- Overridden declarations — what lost the specificity fight and why
- Pseudo-element styles
- Animations via
@keyframes - CSS at-rules including
@position-try,@property, and@function
Output is paginated via pageSize and pageIdx — agents receive styles in chunks rather than one massive response, which keeps token usage manageable on complex pages.
Here is what this changes in practice. An agent gets a bug report: the modal button has wrong padding. Previously, the agent reads modal.css, guesses that some parent rule might be overriding, and suggests adding a class or strengthening the selector. It cannot see what the browser actually computed. With get_css_styles, the agent connects to Chrome via the DevTools MCP server, snapshots the page, calls the tool on the button element, and sees exactly which rule is winning — source file, line number, specificity, and all. It can then propose a surgical fix rather than a workaround.
One known limitation: inherited rule attribution inside Shadow DOM is currently incorrect (GitHub issue #2949 is open). If your component architecture relies heavily on Shadow DOM encapsulation, expect misfiled attribution until that ships.
The CSS Anchor Positioning Editor
CSS anchor positioning has been available for over a year, but editing it has meant hand-tuning abstract offset values. The November update adds an interactive position-area editor: click the swatch in the Styles panel to open a visual grid, select anchor regions by clicking, configure axes independently, and toggle the self keyword. A new viewport overlay renders the inset-modified containing block (IMCB) directly on the page, showing margin, padding, border, and content boxes for anchored elements as you work.
Right-clicking a popover adorner now surfaces all implicit anchors for that element, letting you jump to any associated anchor in the DOM without hunting.
Memory Leaks: Closure Variables Now Surfaced
A classic JavaScript memory leak pattern is surprisingly hard to spot: a closure in a scope keeps every variable in that scope alive, even ones that appear unused. The Memory panel now parses V8 context scope metadata to detect exactly these cases — variables retained by sibling closures that look innocent in a heap snapshot but are holding memory hostage. This has been diagnosable via raw heap diff for years; DevTools now names the culprits directly.
Persistent Local Overrides
Local response body overrides now survive page navigations. This sounds minor. If you use Network overrides to mock API responses during development, you know it is not. Re-applying overrides on every navigation has been a daily annoyance since the feature launched. It is fixed.
Connecting Your Agent Today
If you are using Claude Code, the DevTools MCP plugin installs from the marketplace:
/plugin marketplace add ChromeDevTools/chrome-devtools-mcp
/plugin install chrome-devtools-mcp@chrome-devtools-plugins
For any other MCP-compatible agent, the generic configuration works:
{
  "mcpServers": {
    "chrome-devtools": {
      "command": "npx",
      "args": ["-y", "chrome-devtools-mcp@latest"]
    }
  }
}
On Chrome M144 and later, the --autoConnect flag connects to your already-running browser instance rather than launching a new one. Enable remote debugging at chrome://inspect/#remote-debugging first. The full getting started guide covers all supported agents including Gemini CLI and Antigravity.
Where This Is Heading
Chrome DevTools for Agents went stable at Chrome 149. The progression since has been methodical: screenshots, navigation, interaction, page snapshots — and now live CSS state inspection. Runtime JavaScript inspection of arbitrary application state is the obvious next step, and Google has not been subtle about the direction.
This matters because the 2026 developer tooling story is about agents that need real observability of running code — not just source files. GitHub’s Octoverse 2026 report found agents initiate 40% of pull requests. For that ratio to keep climbing on frontend code, agents need to see the browser’s state. get_css_styles is a meaningful step toward that. Not magic, but a real gap closed.
The full feature breakdown is in the official Chrome DevTools November 2026 post.