 By
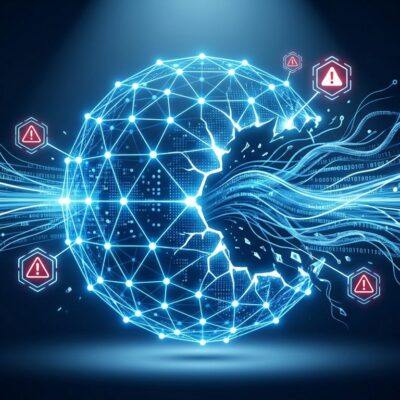
By An agent at one company silently retried a failing tool call 31,000 times before anyone noticed. The bill was $4,700. The agent never threw an error — it just kept going. This is the failure mode traditional monitoring was not built to catch, and it is exactly what DigitalOcean is targeting with three new tools launched in public preview on October 12.
What DigitalOcean Just Shipped
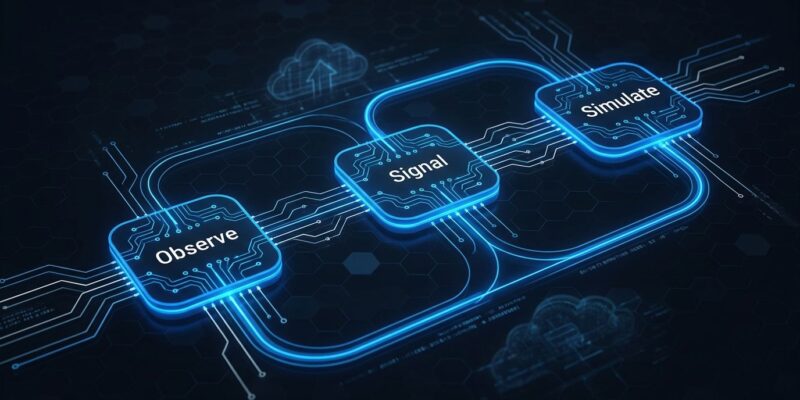
The release bundles three products under the “Agent Learning Services” umbrella: Insights for observability, Signals for automated failure detection, and Evaluations & Simulations for pre-ship regression testing. Together they form what DigitalOcean calls the Agent Improve Loop — a closed cycle that watches what your agent does in production, surfaces where it breaks, and lets you validate a fix before users see it. No extra instrumentation required.
All three are free during the public preview.
The Problem: Agents Fail Silently
AI agent failures are a different animal from traditional software bugs. They are non-deterministic, multi-turn, and state-dependent. The same input can produce different execution paths on different runs. Failures compound across conversation turns. And when an agent goes wrong, it often does not throw an exception — it returns a plausible-looking response built on flawed reasoning somewhere in turn three.
Existing APM tools handle LLM logging well. What they miss is multi-step causal analysis: the agent correctly called the tool, misread the response, and then spent the next five turns reasoning from bad data. That failure is invisible to Datadog. It is invisible to New Relic. It shows up only when a user submits a support ticket three days later.
Signals: Automated Triage of What Broke
Signals watches production traffic on DigitalOcean Managed Agents and Serverless Inference and flags the sessions that went wrong — stalled agents, looping agents, frustrated users, failing tool calls — without requiring any code changes. The data already flows from the platform.
The triage method backs this up with numbers: an 82% informativeness rate and a 1.52x efficiency gain over random sampling on the τ-bench benchmark. Instead of manually combing through thousands of production sessions to find the failures, Signals surfaces the ones that actually matter, and it does so more reliably than picking sessions at random.
That is not a minor convenience. At any reasonable production volume, the difference between “randomly sample sessions and hope you find failures” and “automatically get a prioritized list of what broke” is the difference between catching a problem in hours versus weeks.
Evaluations & Simulations: Test the Fix Before Shipping It
Identifying failures is only half the problem. The other half is knowing whether your proposed fix actually works before you push it to production. Once Signals flags failing sessions, you can feed those real scenarios — or describe new ones in plain language — into Simulations. It runs your candidate change through them in an isolated sandbox using the same tools and harness as production, then grades each run. Ten scenarios run end-to-end in under a minute.
Supported agent runtimes are Claude Code, Codex, and OpenCode. LangChain and CrewAI are not yet supported in this first release. The full launch post is here.
Insights: The Observability Foundation
Both Signals and Simulations run on top of Insights, which pulls metrics, logs, and traces from agents, apps, and infrastructure into a single view. Coverage spans Managed Agents, Serverless and Batch Inference, Inference Router, Action Gateway, DOKS, and App Platform — all backed by OpenTelemetry, so your data stays in a portable, open format rather than a proprietary silo.
The Action Gateway integration is where this gets useful. Because Action Gateway sits in front of all tool calls in Managed Agents, Insights can trace a single agent turn from the model call through every tool the agent invoked — giving you the execution graph you need to understand why turn seven produced the wrong answer.
How This Differs From What’s Already Out There
Langfuse, LangSmith, Maxim AI, and AgentOps all do parts of this. The difference is instrumentation and integration. Every standalone observability tool requires you to add SDK calls to your agent code, maintain a separate account, and manually connect the dots between what the agent did and what the infrastructure did.
DigitalOcean’s edge is that the observability is native to the execution environment. Insights, Signals, and Simulations all draw from the same telemetry that already flows through Managed Agents. The loop is built in, not bolted on. See a fuller comparison of available tools at Latitude’s 2026 observability comparison.
Getting Started
All three tools are available in the DigitalOcean Cloud Console and via doctl, free during the public preview. Existing Managed Agents users have access automatically. Agent Data Services — the fourth piece, which gives agents a managed place to read context and write back what they learn — is in private preview; request access at try.digitalocean.com/agent-data-services-private-preview. Full documentation is at docs.digitalocean.com/products/insights.
Deploying an agent was never the hard part. Keeping it working is. DigitalOcean just gave teams a closed loop to do that without building Anthropic-scale internal tooling from scratch.