 By ByteBot
There is a specific kind of friction that every developer who takes OpenTelemetry seriously will recognize: you can instrument your service, configure your exporters, and ship clean traces and logs to production — but locally, during development, you see nothing. Setting up Grafana, Loki, Tempo, and Prometheus locally is an afternoon of work. Connecting to a cloud backend costs money and sends your dev data off-machine. Most developers quietly skip it and fly blind until staging. JetBrains just made that tradeoff unnecessary.
Starting with the 2026.2 IDE release cycle, the JetBrains OpenTelemetry plugin — previously exclusive to Rider (.NET) — is now available in IntelliJ IDEA, GoLand, PyCharm, and WebStorm. It surfaces logs, metrics, traces, and a service map from your running local application inside a dedicated IDE tool window. No separate backend required. No Grafana. No docker-compose file with five services in it.
What the Plugin Actually Does
The plugin is not an instrumentation tool. If your application does not already emit OpenTelemetry Protocol (OTLP) signals, installing the plugin will show you an empty screen. What it does is act as a local OTLP receiver — a backend that lives inside your IDE and captures signals your instrumented app is already emitting.
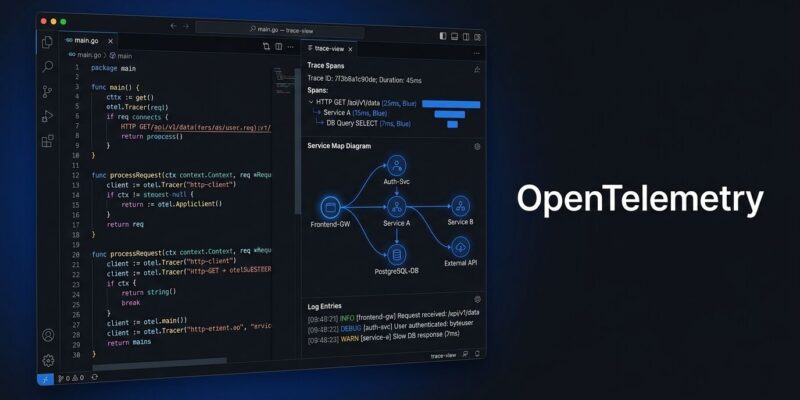
Once connected, the OpenTelemetry tool window gives you four views. The Logs tab shows a searchable table of log records with timestamps, severity levels, and attribute inspection. The Metrics tab plots gauges, sums, and histograms in real time, with attribute filtering to isolate specific dimensions. The Traces tab displays a span hierarchy across services with timing breakdowns that answer the question “where did this request spend its time.” The Service Map auto-generates an architecture diagram from your actual runtime traces, showing observed relationships between services, endpoints, databases, and message queues — not what you think your architecture looks like, but what it actually does under the request flows you exercised.
How to Connect Your Application
Setup takes four steps:
- Open Settings (Ctrl+Alt+S) → Plugins → search “OpenTelemetry” → Install
- In Tools | OpenTelemetry settings, enable “Use fixed OTLP server port” and set it to 17011 to stabilize the endpoint across restarts
- Start your instrumented application from a supported IDE run configuration — the plugin automatically injects
OTEL_EXPORTER_OTLP_ENDPOINTand the related OTLP environment variables - Exercise your application’s features and watch signals populate in the tool window
If you already send telemetry through an OpenTelemetry Collector, add the plugin’s receiver as a second OTLP exporter in your Collector pipeline. Data continues flowing to your existing destinations while the IDE tool window shows the same signals. One important constraint: the plugin accepts OTLP over gRPC only — HTTP is not supported by the built-in receiver. If your application or Collector exports over HTTP, you will need to adjust your exporter configuration before connecting.
The AI Angle: Agents That Can Query Your Traces
The more forward-looking feature is experimental: the plugin exposes four MCP tools through JetBrains’ built-in MCP server. Coding agents running inside the IDE — GitHub Copilot, Claude — can now call get_log_records, get_spans, get_services, and get_service_map to query the telemetry collected during a local run. That means you can ask your coding agent to investigate a slow span, correlate a log error with a specific request, or describe the services your last test exercised — and the agent will have actual runtime data to work with, not just static code to read.
This is early and labeled experimental, but the direction is clear: JetBrains is positioning observability data as a first-class input into AI-assisted development, not just a thing that happens in a separate browser tab after a deployment.
Why This Matters for the OTel Majority
According to OpenTelemetry’s developer experience survey, the most cited local development pain point is the absence of “an easy-to-setup local environment to see all telemetry from a running application.” Sixty-one percent of developers are already running OpenTelemetry in production according to OTel’s 2026 community survey. The instrumentation is done. The data exists. The problem has been that local visibility required standing up a separate stack. The JetBrains plugin collapses that gap to a Marketplace install.
Be honest about its limits, though. The plugin will not replace your production observability platform — it explicitly is not designed to. It accepts gRPC only, so you may need to adjust your exporter configuration. And if you have not yet instrumented your application, the plugin has nothing to show you. Instrument first using the OpenTelemetry zero-code instrumentation guides for Java, Python, Go, or .NET, then come back.
Get It Now
The plugin is available in the JetBrains Marketplace today. It requires IntelliJ IDEA, GoLand, PyCharm, WebStorm, or Rider at version 2026.2 or later. If you are already shipping OTel signals from your services, adding local visibility to your development loop costs less than ten minutes. At that price, not trying it is harder to justify than trying it.