If you are running AI agents in production without OpenTelemetry instrumentation, you are operating blind. You know the request took 6 seconds and cost $0.18 — but not which of the four model calls inside that agent loop caused the latency spike, how many tokens the reasoning step consumed versus the tool call, or whether a tool failed silently. The OpenTelemetry GenAI semantic conventions fix this. LLM client span attributes stabilized in early 2026, and you can get your first model call instrumented in about fifteen minutes.
Know What Is Stable Before You Build
The single biggest confusion in the community is not knowing which OTel GenAI attributes are safe to put in production dashboards. The tier map:
- gen_ai.chat and gen_ai.embeddings spans — Stable. Ship these to production dashboards today.
- gen_ai.agent.* spans — Experimental. Useful, but expect attribute renames. Use the opt-in flag.
- mcp.* spans — Development. The spec is still being written. Do not build dashboards on these yet.
The environment variable that unlocks experimental attributes without breaking existing dashboards:
OTEL_SEMCONV_STABILITY_OPT_IN=gen_ai_latest_experimentalThis dual-emits both legacy and new attribute names. If you have existing dashboards built on older attribute names, they keep working while you migrate.
What Traditional APM Is Not Showing You
Standard application performance monitoring gives you the outer HTTP call. You see POST /v1/messages 4.2s 200 OK. That is it. The official gen_ai client span specification adds the attributes that actually matter:
gen_ai.request.model— Which model handled the callgen_ai.usage.input_tokensandgen_ai.usage.output_tokens— Exactly how many tokens burnedgen_ai.response.finish_reasons— Why generation stopped. “max_tokens” means your output got truncated — a bug, not a feature.gen_ai.provider.name— Useful when routing across providers
Combine these with standard trace timestamps and you shift from “something was slow” to “LLM call 2 used 890 input tokens and ran for 3.1 seconds — that is where your latency is coming from.”
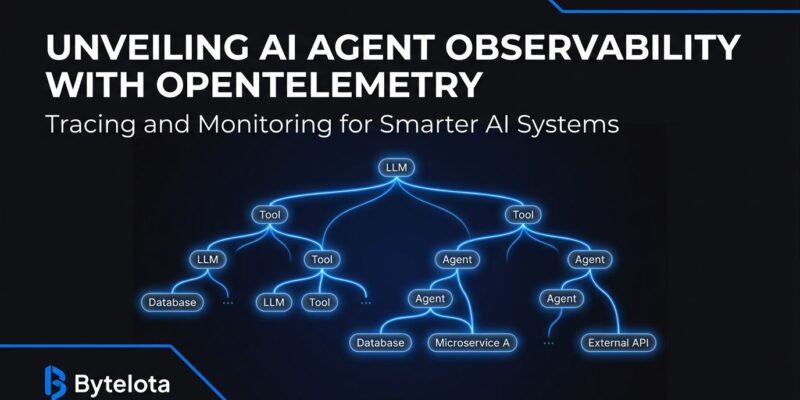
The Span Hierarchy That Makes Agents Debuggable
The thing that actually unlocks agent debugging is the parent-child span relationship. When every LLM call and every tool call is a typed child span, your trace viewer shows you exactly where time and tokens went:
agent.run (total: 5.8s)
├── gen_ai.chat  1.2s  450 tokens
│   └── gen_ai.tool.call: search_web  0.8s
├── gen_ai.chat  3.1s  890 tokens   ← your problem
│   ├── gen_ai.tool.call: read_file   0.1s
│   └── gen_ai.tool.call: write_file  0.2s
└── gen_ai.chat  0.9s  210 tokens
Without instrumentation, the 5.8-second request is a black box. With it, you see LLM call 2 burned 890 input tokens and that is where you focus your optimization work. For teams not using a framework that already emits these spans, the manual instrumentation is straightforward:
from opentelemetry import trace
from opentelemetry.semconv.ai import SpanAttributes

tracer = trace.get_tracer("myapp.ai")

with tracer.start_as_current_span("gen_ai.chat") as span:
    span.set_attribute(SpanAttributes.GEN_AI_SYSTEM, "anthropic")
    span.set_attribute(SpanAttributes.GEN_AI_REQUEST_MODEL, "claude-sonnet-4-6")

    response = client.messages.create(...)

    span.set_attribute(SpanAttributes.GEN_AI_USAGE_INPUT_TOKENS,
                       response.usage.input_tokens)
    span.set_attribute(SpanAttributes.GEN_AI_USAGE_OUTPUT_TOKENS,
                       response.usage.output_tokens)
    span.set_attribute("gen_ai.response.finish_reasons",
                       [response.stop_reason])
Most Teams Are Already Halfway There
If you are using a popular AI framework, it likely already emits OTel-compliant spans. LangChain emits native OTel spans via the langchain-opentelemetry package. CrewAI emits spans for agent tasks and tool calls. AutoGen and AG2 both have OTel instrumentation packages. For framework users, the practical path: set OTEL_EXPORTER_OTLP_ENDPOINT to your collector URL, restart, and your framework handles span creation. No instrumentation code — just an environment variable.
One Standard, Every Backend
The strategic case for OTel over vendor-specific SDKs: every major observability platform now supports gen_ai.* attributes natively. Datadog announced native support for OTel GenAI semantic conventions. Honeycomb, New Relic, Grafana, and Dynatrace all support them. Instrument once against the standard, route your telemetry to any backend, switch backends without touching instrumentation code. Vendor-specific LLM observability SDKs do not offer this. You instrument with their SDK, you are locked to their platform — a bet worth avoiding in a market moving this fast.
What Is Coming Next
The OTel GenAI SIG is actively expanding three areas. The agent span semantic conventions are growing to cover multi-agent systems — tasks, agent teams, memory operations, and artifact tracking. Stable mcp.* attributes for MCP tool tracing are in progress; when those land, you will have end-to-end visibility from agent invocation through every MCP tool call. Standardized cost-tracking attributes and quality signals like time-to-first-token are also on the roadmap.
The overhead argument against instrumentation does not hold: OTel adds under 1ms per call, and LLM API latency runs 100ms to 30 seconds. Per OpenTelemetry’s GenAI observability guide, the cost of not instrumenting — debugging agent failures by guesswork — is substantially higher. If you are shipping agents to production, instrument them first. Visibility before features.