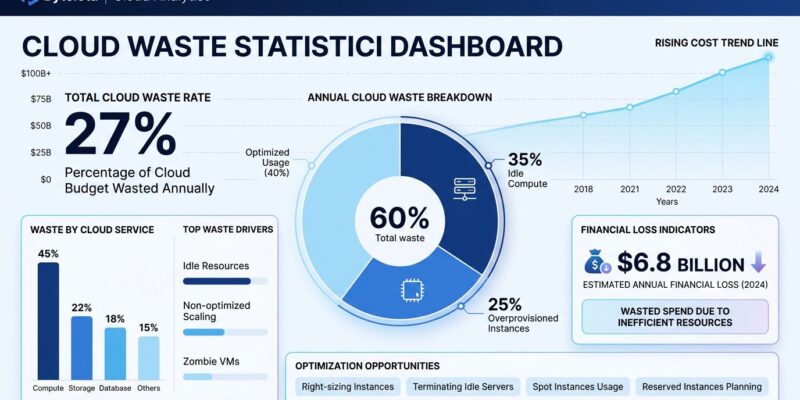
Organizations are wasting over $100 billion on cloud infrastructure in 2026, representing 27% of all cloud spending globally. That’s not a rounding error — it’s a systemic failure at the scale of entire national budgets. While cloud computing promised efficiency and cost optimization, the reality is that most companies hemorrhage money on idle compute, overprovisioned instances, and visibility gaps they can’t even measure.
The waste breaks down into predictable patterns: idle compute accounts for 35% of waste, overprovisioned instances take another 25%, and the rest gets lost in orphaned storage, unnecessary data transfer, and resources nobody remembers provisioning. Collectively, idle resources and overprovisioning represent 60% of cloud waste — the highest-ROI targets for any optimization effort, according to SpendArk’s State of Cloud Waste 2026 report.
Where the $100 Billion Goes
Compute waste is the single largest category, accounting for 35% of all wasted cloud dollars. Developers provision EC2 instances, databases, and Kubernetes clusters liberally during development and rarely revisit sizing decisions after deployment. The result: 10-15% of monthly invoices come from idle or stopped resources that serve no purpose.
Overprovisioning adds another 10-12% to total waste. Teams choose instance sizes at launch based on worst-case capacity planning and never optimize once actual usage patterns emerge. A database provisioned for 10,000 concurrent users runs at 8% utilization for years because nobody has incentive to downsize it — until the CFO sees the bill.
Furthermore, orphaned storage artifacts contribute 3-6% of avoidable spend. EBS volumes detached from terminated instances, snapshots from deleted databases, and S3 buckets from abandoned projects accumulate like digital landfills. Nobody owns them, nobody deletes them, and the costs compound month after month.
The Startup vs Enterprise Paradox
Startups waste 30-40% of cloud spend; enterprises waste 18-25%. This difference has led to a narrative that startups are careless with money. However, that’s wrong. Startups have structural reasons for higher waste rates that are entirely rational.
Small teams move fast and prioritize velocity over governance. They provision liberally because the cost of downtime from underprovisioning exceeds the cost of overprovisioning. There’s no dedicated FinOps function, and cloud optimization competes directly with feature development for scarce engineering time. When you have three engineers building a product, asking them to optimize S3 lifecycle policies is a distraction from survival.
Enterprises waste less as a percentage but thousands of times more in absolute dollars. A Fortune 500 company with dedicated FinOps teams, governance processes, and enterprise discount agreements might waste “only” 20% — but at $500 million in annual cloud spend, that’s $100 million burned. Meanwhile, a seed-stage startup wasting 35% of $10,000 monthly loses $3,500. The percentages mislead.
The real scandal isn’t that startups waste more. It’s that enterprises with dedicated teams, structured processes, and billions at stake still waste 18-25%. Consequently, that suggests either the problem is harder than FinOps vendors admit, or there’s an optimization floor below which effort exceeds return.
FinOps ROI Reality: 30-40% Savings, Then Diminishing Returns
Organizations using FinOps frameworks are 2.5 times more likely to meet or exceed cloud ROI expectations. Moreover, mature programs achieve 30-40% cost efficiency improvements with typical ROI of 10-20x in 30-60 days. Those are real numbers from the State of FinOps 2026 report, not vendor marketing.
Service-specific wins compound: CloudTrail optimization can cut costs by 94% through elimination of unused log streams, EC2 rightsizing delivers up to 66% savings, and S3 lifecycle management reduces storage costs by 55%. Early adopters report 40% waste reduction in first six months. The “big rocks” are genuinely big.
But practitioners admit the curve flattens. “We have hit the big rocks of waste and now face high volume of smaller opportunities requiring more effort to capture,” one FinOps lead reported. Furthermore, structured programs reduce waste from 35-40% down to 20-25%, then mature programs push it to 15-20%. Getting below 15% appears to be a wall.
FinOps has evolved beyond pure cloud cost management in 2026. Ninety-eight percent of FinOps teams now actively manage AI spend — the most in-demand skill this year. Additionally, seventy-eight percent report into CTO/CIO organizations rather than finance, reflecting that FinOps is now viewed as strategic technology capability. The scope expanded faster than the headcount.
The Visibility Crisis: 80% Have Gaps, 53% See No ROI
Eighty percent of organizations report widening visibility gaps across cloud operations. Only 23% possess full cloud transparency. The fundamental problem: you can’t optimize what you can’t see, and most companies can’t see their cloud spending in actionable ways, according to CloudZero’s 2026 cloud computing statistics.
Fifty-four percent of cloud waste stems directly from lack of cost visibility. Complex pricing models across AWS, Azure, and GCP make real-time cost tracking nearly impossible without specialized tools. Native platforms like AWS Cost Explorer update once every 24 hours — meaning a cost anomaly that begins at deployment may not surface until the following day, after thousands of dollars have burned.
Cost attribution fails at scale. Eighty-seven percent of organizations use tagging as their primary allocation method, yet successfully allocate only 75% of cloud costs on average. Shared resources like S3 buckets and Kubernetes clusters create persistent blind spots. For instance, when a multi-tenant Kubernetes cluster serves 20 microservices, how do you allocate the control plane costs? Most companies give up and call it overhead.
The ROI measurement crisis compounds the visibility problem. Forty-eight percent of CFOs lack confidence in their ability to measure cloud ROI. Fifty-three percent of enterprises say they haven’t seen substantial value from cloud investments yet. When half of business leaders cite difficulty measuring ROI as a key barrier, the problem isn’t technical — it’s structural.
The Hidden Tax: Egress Fees and Cloud Repatriation
Egress fees account for 6-12% of cloud bills but rarely appear in cost projections. AWS charges $0.09 per GB, Azure $0.087 per GB, and GCP $0.12 per GB for data transfer out of their networks. For example, a SaaS application serving 50TB monthly pays $4,300 per month in egress alone — $51,600 annually just to deliver data to users.
Additionally, data movement between Availability Zones adds another $0.01 per GB in each direction. Multi-region architectures multiply these costs across every GB replicated for redundancy. The fees compound until egress becomes one of the fastest-growing line items on cloud bills.
Forty-five percent of organizations have repatriated some workloads back on-premises or to alternative providers, citing unpredictable egress costs as a primary driver, according to FinOut’s 2026 cloud statistics. This isn’t cloud backlash — it’s rational economics. When predictability matters more than marginal efficiency, dedicated servers with flat monthly costs beat consumption-based pricing that varies by usage patterns you can’t control.
What Elite Teams Do Differently
Organizations that minimize waste without hitting optimization floors share common practices. They implement real-time visibility rather than waiting for monthly bill post-mortems. They surface cost insights to engineers during development, not after deployment. They automate enforcement: idle resources get shut down automatically based on configurable policies, not manual audits.
Moreover, elite teams achieve 100% cost allocation, not the 75% industry average. They integrate FinOps into the software development lifecycle so cost becomes a first-class design constraint like performance or security. They use caching strategies that reduce egress traffic by 40-60%. They optimize Reserved Instances and Savings Plans systematically rather than reactively.
The difference isn’t tools — it’s culture. When developers see costs in their IDE and dashboards show team-level spend in real-time, behavior changes. When overprovisioned instances get flagged automatically and rightsizing recommendations appear in pull requests, waste decreases. When cost is visible, it becomes manageable.