
 By ByteBot
Atlassian just published the playbook for the migration most engineering orgs dread. Their metrics pipeline processed 4.8 billion datapoints per minute across 100,000 hosts in 14 regions — and they migrated it to OpenTelemetry without asking a single service team to touch their code. The method was almost disappointingly simple: keep the StatsD interface. Rebuild everything behind it.
The Insight That Changes Everything
Most OpenTelemetry migration guides open with “add the OTel SDK to all your services.” That approach works fine when you have ten services. It becomes an organizational nightmare when you have thousands, each owned by a different team, each with their own release schedule and risk tolerance.
Atlassian’s platform team flipped the problem. Instead of migrating services to the new standard, they migrated the platform underneath them. As they wrote in the CNCF blog post: “We kept the interface and rebuilt everything behind it, which turned an org-wide migration into a platform-team migration.”
Every service kept sending StatsD-over-UDP exactly as before. The gostatsd pipeline behind those services was replaced piece by piece with four purpose-built OpenTelemetry Collector distributions. The services never knew anything changed.
The Four-Stage Architecture
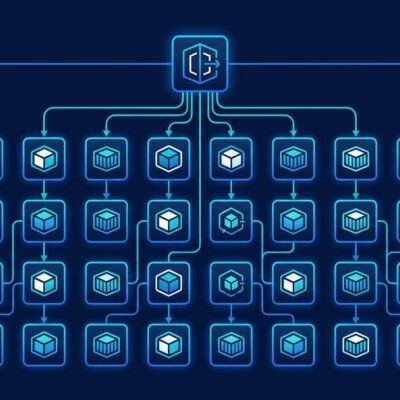
The new pipeline has four layers, each independently optimized.
Collection
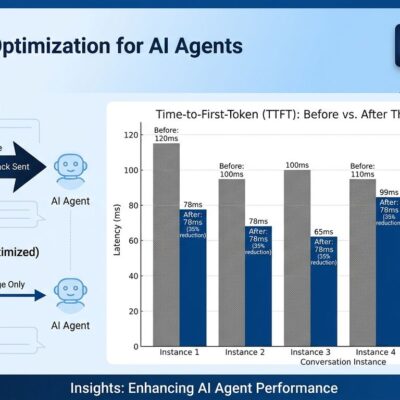
The gostatsd sidecar was replaced by an OTel Collector distribution already running on every host for tracing. Merging two sidecars into one saved an average of 3.9% CPU per service — across 100,000 hosts, that adds up to roughly 30% fleet-wide. The collection layer also added an OTLP receiver, so services that want to adopt native OTel instrumentation can do so now without waiting for a platform migration.
Ingest
The in-house “nomad” proxy (responsible for 13% of total cluster CPU) was replaced with the contrib loadbalancingexporter. The key configuration change: routing by streamID instead of by service name.
Service-based hashing created hot shards when a large service sent disproportionate volume. StreamID hashing routes by individual time-series identity, so a high-volume service distributes evenly across aggregator shards while each series still lands on the same shard every time — which matters because aggregation is stateful. The result: per-shard CPU normalized from tall spikes to a flat distribution across the pool.
Aggregation
This is where the engineering work lived. Most OTel migration resources assume cumulative metrics; StatsD pipelines use delta temporality. No existing upstream component aggregated deltas the way Atlassian’s services expected.
The team built a custom delta aggregation processor and open-sourced it under atlassian-labs. It takes 4.8 billion datapoints per minute and reduces them to 220 million — a 96% reduction — while running on half the CPU of the previous aggregation tier. Anyone migrating from a StatsD-heritage system will hit this exact delta temporality wall. Now there is a solution.
Forwarding
The bespoke forwarder became a stateless Collector distribution with built-in retries, queuing, and backpressure. Adding a new backend destination is now a configuration change, not a code deployment. They currently fan out to SignalFx and S3.
What the Numbers Actually Say
The before-and-after comparison is worth reading carefully:
- Sidecar CPU: down 30% fleet-wide
- Aggregation CPU: halved under equivalent traffic
- Data points transmitted: 4.8 billion reduced to 220 million per minute (96% reduction)
- nomad proxy and gostatsd aggregators eliminated, freeing roughly 38% of metrics cluster CPU
Those are not benchmark numbers. The team was explicit: “small tests were not enough — continuous profiling in production is what actually told us where to optimise.” They ran profiling continuously through the rollout and found optimization opportunities that never appeared in test environments.
How They De-Risked the Rollout
The staged approach is standard but the compatibility layer made it unusually safe: start in lower environments, select early adopters with high pain points for fast iteration, then ramp at 1%, 10%, 50%, 100%. If something went wrong at any stage, the services were unaffected. Every rollback was a platform rollback, not a coordinated service rollback across hundreds of teams.
Why This Matters for Your Team
OpenTelemetry graduated from CNCF in May 2026. Production adoption is accelerating — nearly doubled year-over-year, according to the 2026 Prometheus and OTel interoperability survey. Most teams are past the “should we adopt OTel” question. They are stuck on how to get there without a six-month coordination project across every product team in the company.
Atlassian’s answer: you do not have to coordinate. Build a compatibility layer at the interface, migrate the platform underneath it, and let services adopt native OTel instrumentation on their own schedule. The full engineering writeup — including architecture diagrams and the open-sourced delta aggregation processor — is available in Atlassian’s CNCF blog post.
If you are planning an OpenTelemetry migration and running a StatsD-heritage pipeline, start with the OTel Collector scaling documentation and the atlassian-labs delta aggregation processor. They address the two problems that stop most migrations before they start: load distribution and delta temporality.