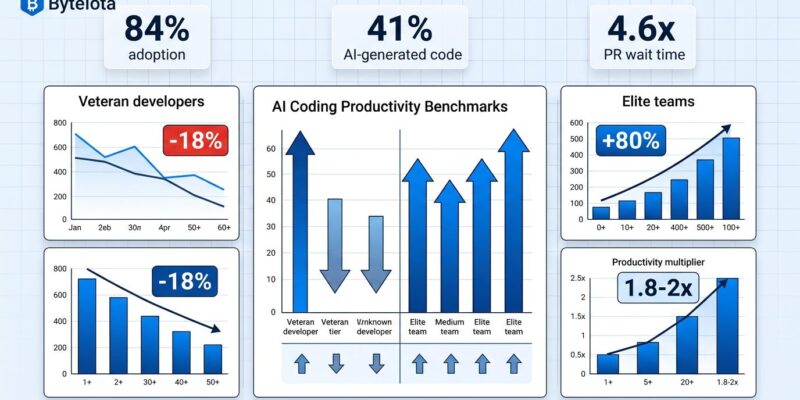
Despite 84% of developers adopting AI coding tools and 41% of all code now being AI-generated, productivity gains remain inconsistent and sometimes negative. LinearB’s analysis of 8.1 million pull requests across 4,800 teams reveals a productivity paradox: AI-generated code waits 4.6 times longer for review than human-written code, creating a bottleneck that offsets generation speed gains. METR’s productivity study shows veteran developers experiencing an 18% slowdown when using AI tools, directly contradicting both developer perception and industry hype. With near-universal adoption, teams need data-driven benchmarks to measure actual productivity impact, not perceived benefits.
Why AI PRs Create a Review Bottleneck
The numbers tell a counterintuitive story. AI accelerates code generation, but AI-generated pull requests wait 4.6 times longer for human review compared to human-written code. Once a reviewer picks up an AI PR, they complete the review twice as fast—but getting that initial attention takes significantly longer. The bottleneck has shifted from writing code to reading code.
Three factors drive this bottleneck. First, AI-assisted PRs regularly exceed 800 lines, requiring more reviewer time and cognitive load. Second, human reviewers scrutinize AI-generated code more carefully due to trust gaps—they need to verify the AI understood the context correctly. Third, the sheer volume of PRs has surged because AI accelerates generation, overwhelming review capacity. Senior engineers now spend more time reviewing than writing, and their review queue has become the team’s limiting factor.
Some teams have responded by introducing “max diff size” policies to combat large AI PRs, but this addresses symptoms rather than causes. Elite teams take a different approach: they optimize the review process itself with AI pre-review systems that provide structured feedback within 60 seconds of PR creation, reducing back-and-forth cycles before human review even begins.
What Elite Teams Do Differently
Top-performing teams achieve 1.8 to 2.0 times productivity multipliers with AI by combining high usage rates with process optimization and quality gates. Larridin’s 2026 benchmarks show elite teams maintain 80% or higher weekly active AI usage across their entire team, keep AI-assisted code share between 60-75%, and sustain sub-8-hour PR cycle times while keeping code turnover ratios below 1.3 times their human baseline.
The industry has converged on Complexity-Adjusted Throughput (CAT) as a fairer productivity measure. CAT assigns points based on PR difficulty: easy PRs earn 1 point, medium PRs earn 3 points, and hard PRs earn 8 points. Baseline productivity averages 8 points per engineer per week for all work, but AI-assisted work reaches 12 points per week. Elite teams push this to 1.8-2.0 times multipliers, though the multiplier compresses at higher complexity levels because hard PRs benefit less from current AI tools than easy or medium ones.
Code turnover ratio has emerged as the critical quality metric for AI-assisted development. This measures the percentage of merged code that gets reverted, deleted, or substantially rewritten within 30 to 90 days. Healthy AI code shows turnover below 15% at 30 days and below 22% at 90 days. However, the ratio between AI-generated and human-written code turnover should stay within 1.5 times, though the industry average in 2026 sits at 1.8 to 2.5 times—suggesting most teams have room for improvement. Keeping AI code share in the 25-40% range prevents quality degradation, while elite teams with strong governance can sustain 60-75%.
The Veteran Developer Learning Curve
Veteran developers slow down initially with AI tools, and the data proves it. METR’s productivity studies tracked the same cohort of experienced developers from early 2025 to early 2026. In the first study, these developers showed a 19% slowdown with AI tools. Moreover, one year later, using improved AI tools and having learned better workflows, the same developers showed an 18% speedup—a stunning 37-point swing that demonstrates the learning curve is real and significant.
The workflow shift explains the initial slowdown. Veteran developers transition from solo creators to collaborative reviewers of AI output, requiring hundreds of hours of practice to see benefits. They must learn when to trust AI suggestions versus when to verify them, while managing the mental overhead of AI interactions. Unlike junior developers who show 39% faster task completion with tools like GitHub Copilot, senior developers see only 8-16% initial improvements because they have ingrained coding patterns to unlearn.
Organizations that give veterans time and training see the J-curve pattern: initial performance drops during adoption, gradual improvement during experimentation, and significant gains after mastery. METR’s updated 2026 study with a new cohort of 57 developers showed a more modest 4% slowdown with a confidence interval of -15% to +9%—substantially less negative than the original findings and closer to neutral territory as more developers move up the learning curve.
Task Complexity Determines AI Effectiveness
McKinsey’s study of 4,500 developers across 150 enterprises reveals the complexity ceiling: AI coding tools reduce time spent on routine coding tasks by 46%, but time savings shrink to less than 10% on tasks developers deem high in complexity. The inverse correlation between task complexity and AI effectiveness explains why overall productivity gains remain inconsistent—task mix varies by team and project phase.
AI excels at routine work: boilerplate generation, code translation between languages, test case generation, documentation writing, and simple refactoring. But AI struggles with complex debugging, architecture decisions, unfamiliar frameworks, system-wide refactoring, performance optimization, and security-critical code. Teams focusing AI tools on routine work capture the 46% gains; teams expecting AI to handle complex work end up disappointed.
Measurement Becomes Non-Negotiable
Organizations using FinOps-style measurement frameworks are 2.5 times more likely to meet or exceed AI productivity ROI expectations. The perception versus reality gap proves measurement matters: developers consistently believe they’re 20% faster with AI tools, but data often shows they’re slower when accounting for increased review time and code churn. Teams adopting a measurement-first approach see consistent productivity gains, while those relying on perception often face disappointment.
Elite teams in 2026 track five categories of metrics. Adoption metrics measure weekly active usage and AI code share percentage. Velocity metrics track complexity-adjusted throughput and AI multipliers. Quality metrics monitor code turnover ratios, bug rates, and PR size. Process metrics cover PR wait time, review time, and cycle time. ROI metrics balance time saved against quality degradation. The Developer Experience Index, built on 4 million data points from 800 organizations, shows each 1-point gain saves 13 minutes per developer per week—translating to roughly $100,000 annually for a 100-developer team.
Furthermore, the industry is converging on best practices: track AI versus human metrics separately, set quality gates based on turnover thresholds, optimize review processes with AI pre-review, invest in veteran training on workflow shifts, and keep AI code share in the 25-40% sustainable range. You can’t improve what you don’t measure, and the data makes clear that AI productivity requires measurement, not just adoption.