 By
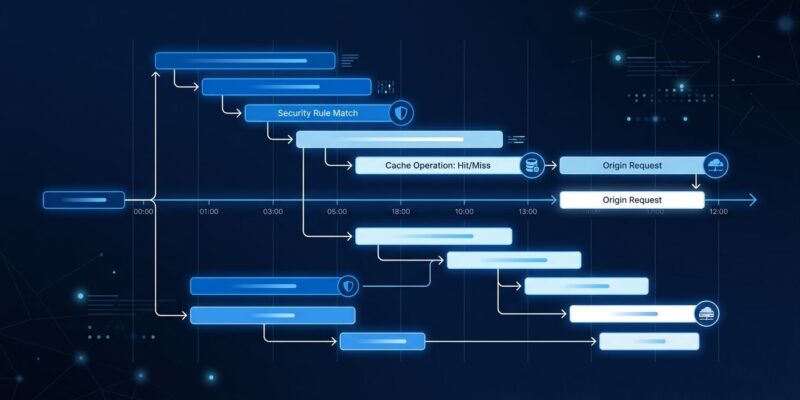
By Cloudflare just ended the proxy-layer black box. Traces — the company’s distributed tracing system — entered open beta on October 10, and it now covers every stage of the request pipeline: security rule evaluation, URL transforms, cache decisions, routing, Worker execution, and origin handling. All as OpenTelemetry spans. No instrumentation code required.
Workers Tracing already existed. It was useful — covering Worker handler calls, KV/R2/D1 binding calls, and outbound fetches. But everything Cloudflare did to a request before your Worker saw it was opaque. You’d stare at a 500ms request and guess: security rule? cache miss? slow origin? Now you don’t have to guess.
What Traces Covers Now
The new proxy-layer spans include:
- Security rules — which rule evaluated the request, how long it took, whether it blocked
- URL Transform Rules — what was rewritten, which rule triggered
- Routing decisions — Page Rules, Snippets, Workers routing
- Cache operations — HIT or MISS, time spent in cache vs. waiting on origin
- Origin handling — full round-trip timing to your backend
Cloudflare’s own example makes the value concrete: a 539ms request where 527ms was spent retrieving an uncached origin response. Previously you’d dig through logs to piece that together. With Traces, it’s one timeline.
How to Enable Cloudflare Traces
For dashboard-only viewing, toggle the setting in your Worker’s configuration panel in the Cloudflare dashboard. For OTLP export to an external backend, add this to wrangler.jsonc:
{
  "observability": {
    "traces": {
      "enabled": true,
      "head_sampling_rate": 0.05
    }
  }
}
The head_sampling_rate controls what fraction of requests get traced — 1 traces everything, 0.05 traces 5%. Head-based sampling eliminates overhead entirely for untraced requests. Supported export destinations include Honeycomb, Grafana Cloud, Axiom, and Sentry — any OTLP-compatible backend works.
Trace Rules: Targeted 100% Sampling
Global sampling creates a dilemma: 100% is expensive, 1% misses intermittent bugs. Trace Rules solve this by letting you apply 100% tracing to specific traffic without changing the global rate.
Target by hostname, source IP, path, header value, HTTP method, or geography. In practice: trace every request to /api/payment while sampling everything else at 5%. Or target a specific customer’s IP during an active incident investigation without flooding your ingestion budget.
Distributed Tracing and the AI Debugging Workflow
Cloudflare now accepts incoming W3C traceparent headers, so traces started in your application propagate into Cloudflare’s proxy spans and continue to your origin. Your existing distributed traces get the proxy layer inserted automatically.
The new Observability MCP server adds a less obvious capability: AI agents can query traces via SQL API. The workflow: an alert fires, a coding agent connects via MCP, queries for failing traces, compares them against successful ones to identify diverging spans, and connects findings to source code. It eliminates the manual log-spelunking step between “alert fired” and “root cause identified.”
Pricing: What Actually Changed
Cloudflare’s pricing communication here has been rough. In August they announced per-event billing starting October 1. In October they reversed it — volume-based pricing, effective December 1, 2026.
- Free tier: 0.5 GB/day ingestion, 7-day retention
- Paid: $0.25/GB ingested + $0.10/GB-month stored; 50 GB/billing cycle included
For comparison, Datadog APM runs $31–47 per host per month on top of separate ingestion costs. For teams running entirely on Cloudflare’s edge, this observability model is meaningfully cheaper — with the honest caveat that it only sees traffic flowing through Cloudflare’s network.
What’s Available Now
Traces is in open beta as of October 10, part of eight observability updates Cloudflare shipped simultaneously. The roadmap includes spans for DDoS rules, Access, Workflows, Queues, and Pipelines. Pricing goes live December 1.
Enable Cloudflare Traces in your Worker settings — it’s off by default, free in the free tier, and tells you things logs never could.