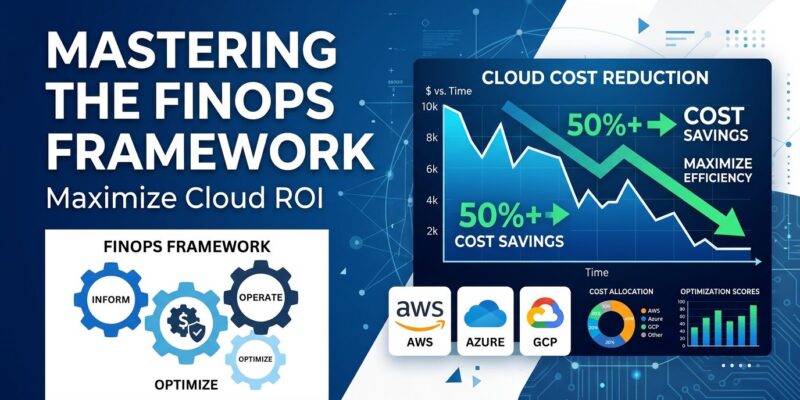
Organizations implementing complete FinOps frameworks in 2026 achieve 30-50% cost savings consistently, yet 78% of companies still waste 21-50% of cloud spend. The difference isn’t awareness—it’s execution. FinOps has evolved from reactive cloud optimization to strategic value management, expanding beyond traditional IaaS to include AI workloads consuming 55-80% of GPU budgets, SaaS subscriptions, and software licensing. Moreover, the paradigm has shifted from “optimize after the bill arrives” to shift-left cost forecasting before deployment, with FinOps teams now serving as strategic partners to C-suite executives.
FinOps Framework Evolution: Beyond Cloud Cost-Cutting
The FinOps Foundation’s 2026 framework updates introduce executive strategy alignment as a core capability, repositioning FinOps from an engineering optimization function to a strategic partner driving multi-year planning and business outcomes. The traditional three-phase model remains—Inform (visibility and allocation), Optimize (rightsizing and discounts), and Operate (governance and sustainability)—but the scope has exploded dramatically.
Where FinOps once focused exclusively on AWS, Azure, and GCP infrastructure, 2026 implementations now cover AI/ML training and inference costs (now the primary driver of runaway spend), SaaS subscription sprawl, software licensing, private cloud, and even data center spend. Furthermore, AI cost management has become nearly universal among FinOps practitioners, reflecting the reality that a single large model training run can cost millions while organizations waste 30-50% of GPU resources through over-provisioning.
The Big Three Cloud Cost Optimizations
Reserved Instances and Savings Plans deliver 30-72% discounts versus on-demand pricing, but the 2026 best practice is layering commitments strategically. Start with a Compute Savings Plan for baseline workloads—it offers up to 72% savings with flexibility to change instance types, regions, or even shift to Fargate and Lambda. Next, add Reserved Instances for data tier services like RDS and DynamoDB where capacity reservation matters and you’re locked to predictable patterns. Finally, supplement with Spot Instances for fault-tolerant scaling at 70-90% discounts. Pinterest runs 80% of its 200-GPU training infrastructure on spot instances, saving $4.8 million annually.
Right-sizing is the highest-ROI optimization because it costs zero dollars to implement. Most cloud waste comes from instances provisioned for peak load but running at 10-20% average utilization. If your CPU averages below 30% or maxes below 50% over two weeks, size down immediately. If RAM usage stays under 40%, you’re paying for digital hoarding. Typical right-sizing delivers 15-25% savings on compute costs, but fully leveraged implementations cut spending by up to 61%. Additionally, Azure’s burstable B-series VMs save 30-50% versus D-series for bursty workloads, and moving from Dv4 to Dv5 generation yields double-digit percentage savings. Even reducing by one vCPU produces significant savings at scale.
Cloud waste elimination targets the 29% of spend that’s pure friction: idle instances still accruing storage costs, orphaned EBS volumes, 24/7 dev environments that should shut down nights and weekends. Organizations cut 27-32% of waste through simple scheduling policies and cleanup automation. However, you must act systematically. Review development environments mirroring production sizing—unnecessary. Delete unattached volumes and old snapshots. Flag instances below 5% CPU for seven consecutive days. These quick wins build momentum for larger optimizations and require no architecture changes.
Tagging and Allocation: The Foundation
You can’t optimize what you can’t measure, and tagging enables the showback, chargeback, and accountability that drive behavioral change. Essential tags include Environment (production, staging, dev), Owner (team or person responsible), Application (which service), CostCenter (financial allocation), and Project (specific initiative). Enforcement is non-negotiable—missing tags mean missing visibility.
Multi-cloud standardization matters significantly. Avoid cloud-specific keys like awsAccountId; instead, use neutral conventions (Owner, Application, Environment) that work across providers. AWS allows 50 tags per resource with case-sensitive keys, Azure supports 50 tags with any case, and GCP labels max out at 64 per resource requiring lowercase letters and hyphens only. Therefore, enforce tagging through AWS Service Control Policies, Azure Policy for required/appended tags, and weekly cleanup routing noncompliant resources to owners.
Not all cloud resources support tags—NAT Gateway data transfer, CloudWatch metrics, GCP egress traffic, and Azure bandwidth charges lack tagging support. Handle these through cost allocation at account or subscription level. Remember, the goal isn’t perfect allocation on day one; start simple, measure compliance, iterate.
Shift-Left FinOps and AI Cost Management
The 2026 paradigm shift is forecasting costs before deployment rather than optimizing after bills arrive. Infrastructure reviews now include cost estimates the same way they include security reviews. Consequently, engineers see cost impact during pull request review, not when the monthly bill lands. Cost becomes a dimension in architecture decisions through cost gates in CI/CD pipelines, Terraform cost estimation via tools like Infracost, and budget alerts for new services. This prevents expensive architectures from reaching production rather than fixing them retroactively.
AI workloads have replaced idle VMs as the primary driver of runaway cloud spend in 2026. Enterprise foundation model training runs cost millions per iteration, and organizations waste 30-50% of GPU spend on over-provisioned resources. Here’s what makes AI cost management fundamentally different: 55-80% of enterprise GPU spending goes to inference, not training. Furthermore, GPU spot instances deliver 70-90% cost reduction compared to on-demand pricing. FP8 quantization on H100 GPUs produces 1.3-2x throughput gains over FP16 with under 2% quality loss, effectively doubling capacity without buying more hardware.
The economics of self-hosting versus managed APIs break even around 50-100 million tokens per month. Below 20 million tokens monthly, managed APIs win on total cost. Above 100 million tokens, self-hosting almost always wins on unit economics. Therefore, AI FinOps requires new measurement layers tracking cost per inference, cost per business outcome (not per API call), latency distributions per model tier, and real-time GPU utilization by workload type. Governance shifts to assigning cost ownership to every model and inference endpoint, with approval workflows for training runs exceeding cost thresholds.
FinOps Team Structure and Tools
FinOps doesn’t happen in spare time—it requires dedicated ownership. Sixty-two percent of mature organizations use a hybrid team structure: a central FinOps team establishes standards and frameworks while embedded practitioners execute within engineering teams. This balances standardization with the flexibility and autonomy engineering cultures demand.
Core roles include FinOps Analysts for cost analysis and anomaly detection, FinOps Engineers handling tagging automation and rightsizing tooling, FinOps Architects designing optimization frameworks, and FinOps Leads driving C-suite alignment and cross-team accountability. Typically, FinOps integrates within a broader Cloud Center of Excellence (CCOE) that includes cloud architecture, security, DevOps, and compliance functions.
The tools landscape splits between established enterprise platforms charging 2-3% of cloud spend (CloudHealth for hybrid cloud governance, Flexera for IT asset management integration, IBM Apptio Cloudability for finance-centric allocation) and emerging players focused on engineering-led optimization and shift-left cost modeling. Native cloud tools—AWS Cost Explorer, Azure Cost Management, GCP Cost Management—provide basic visibility at zero cost but lack advanced governance and automation features. Ultimately, start with native tools to establish baselines, then add third-party platforms where gaps appear.
Expected Outcomes and Implementation Path
Capital One saved over $100 million through resource optimization, vendor negotiation, and financial process automation. Samsung cut $11 million implementing FinOps practices. Meanwhile, a global insurer uncovered $17 million in annual savings with $6 million in immediate quick wins. An adtech company reduced AWS costs 62% by eliminating test data, rightsizing resources, and optimizing usage patterns. Organizations completing the FinOps journey consistently achieve 30-50% savings with 166% ROI within 12-24 months.
Implementation follows a predictable path: First, establish tagging and visibility (you can’t optimize what you can’t measure). Second, capture quick wins through waste elimination to build momentum. Third, layer Reserved Instances and Savings Plans for baseline workloads. Fourth, implement shift-left cost forecasting in development workflows. Finally, tackle AI-specific optimizations. Success requires dedicated team ownership, executive support at the C-suite level, and treating FinOps as continuous practice rather than one-time project. The 78% of companies wasting 21-50% of cloud spend aren’t unaware of the problem—they’re simply not executing the solution.