 By
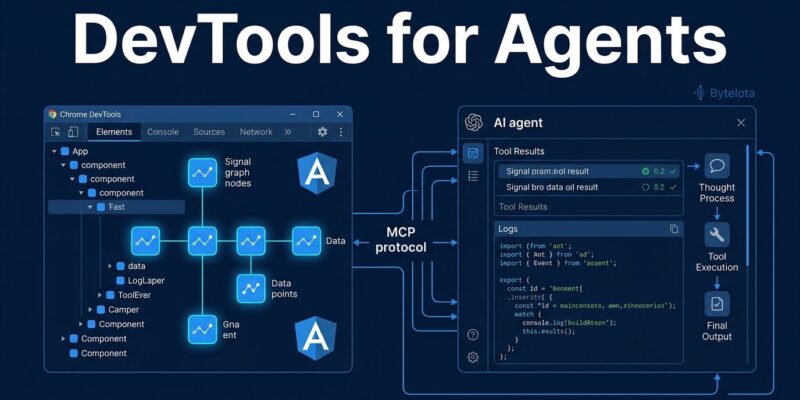
Chrome 153 and 154 shipped an update to DevTools for Agents that changes what AI coding agents can actually do inside your browser. The headline feature: frameworks can now register structured debugging tools that agents query at runtime. That means an agent debugging your Angular app no longer just reads your source files — it can interrogate the live signal graph, map DOM nodes to components, and inspect dependency injection as it’s running. That’s a fundamentally different category of assistance.
Third-Party Developer Tools API
The new third-party tools API works through a devtoolstooldiscovery event dispatched on window. When DevTools for agents navigates to a page or you call list_3p_developer_tools, Chrome fires the event. Frameworks listen for it and register their tools via event.respondWith().
window.addEventListener('devtoolstooldiscovery', (event) => {
  event.respondWith({
    name: "My Framework Tools",
    description: "Runtime debugging tools",
    tools: [
      {
        name: "getComponentTree",
        description: "Returns the live component tree",
        inputSchema: { type: "object", properties: {} },
        execute: async () => myFramework.getComponentTree()
      }
    ]
  });
});
Agents call registered tools via the execute_3p_developer_tool MCP method, with automatic parameter validation from the JSON Schema you provide. DOM elements get special handling — DevTools automatically maps them to UIDs compatible with the take_snapshot tool, so agents can cross-reference DOM inspection with framework state.
Angular is the first major framework to ship integration: a Signal Graph tool for visualizing live state-to-view relationships, and a DI Graph tool for exposing runtime dependency injection provider information. That Angular shipped before React, Vue, or Svelte is a signal worth noting — the Angular team clearly sees agent-assisted development as core to their roadmap. The feature is currently experimental in chrome-devtools-mcp 0.25.0+ behind the --categoryExperimentalThirdParty flag, with stable status expected in Chrome 156.
Agent Plugins 1.0: Write Once, Deploy Everywhere
Chrome DevTools MCP added support for Agent Plugins 1.0 — a cross-vendor portable format that packages MCP servers and Agent Skills into a distributable directory. Vercel initiated the specification in August 2026; AWS, Anysphere, GitHub, Microsoft, and OpenAI are all on board.
The practical upshot: write a DevTools debugging plugin once and it loads in Claude Code, Cursor, Gemini CLI, and Codex without modification. Before Agent Plugins 1.0, every client had its own plugin format and distribution model. Now there’s one format backed by six major vendors — the npm moment for agent extensions.
Heap Snapshot Querying for Agents
The query_heapsnapshot MCP tool — added in chrome-devtools-mcp 1.8.0 — brings structured memory debugging to agents. Instead of parsing raw heap snapshot files, agents can query by retained size threshold or by property name. Edge filtering, retained size sorting, and V8 execution context analysis are all included.
Memory leak debugging previously required a manual six-step process: capture snapshot, load in DevTools, navigate to Summary view, filter by allocation, compare snapshots, interpret output. Agents can now handle the mechanical parts of that workflow through a single structured query.
Security Controls and Performance Completions
Two other additions worth flagging. First, a --no-javascript-evaluation flag that lets agents inspect pages without executing any scripts — useful for security audits and compliance scenarios. Second, full soft navigation support in the Performance panel’s Insights view, completing end-to-end measurement for single-page applications. CPU performance tier overrides via Emulation.setCPUPerformanceOverride enable reproducible cross-hardware testing without physical device farms.
How to Install
If you’re not already running chrome-devtools-mcp, installation is a one-liner. For Claude Code (see our earlier guide on WebMCP in Chrome 149 for background on the agent-browser integration story):
/plugin install chrome-devtools-mcp@chrome-devtools-pluginsFor any MCP-compatible agent, add to your config:
{
  "mcpServers": {
    "chrome-devtools": {
      "command": "npx",
      "args": ["-y", "chrome-devtools-mcp@latest"]
    }
  }
}
The chrome-devtools-mcp repository has crossed 50,700 GitHub stars. If you haven’t connected your agent to your browser yet, the October update makes a strong case for doing it now.