
 By ByteBot
OpenSearch 3.7 landed in July 2026 with two changes that are worth a real look: vector retrieval is now 5.5x faster at k=1000 with no reindexing required, and Prometheus metrics are now queryable with PromQL directly inside OpenSearch Dashboards. Neither change forces you to move data or redesign your architecture. You upgrade, swap one query parameter, and optionally point Dashboards at your existing Prometheus endpoint. That’s about it.
Vector Search That Doesn’t Need a Reindex
The bottleneck in k-NN vector retrieval has always been _source reconstruction. When you fetch vectors from a result set, OpenSearch had to run each document through a five-step pipeline: disk read, decompress, deserialize, inject the vector, re-serialize. At k=1000, that overhead added ~40ms server-side and ballooned response payloads to roughly 8MB per query — a real problem for RAG pipelines and reranking systems running at any meaningful load.
OpenSearch 3.7 fixes this by reading vectors directly from their columnar stored format using docvalue_fields. One seek per document, no decompression pipeline. The numbers:
- End-to-end latency at k=1000: 107ms → 19.3ms (5.5x faster)
- Server-side latency at k=1000: 44ms → 3ms (14.7x faster)
- End-to-end latency at k=100: 16.5ms → 6.5ms (2.5x faster)
- Response payload at k=1000: ~8MB → ~2.5MB (70% reduction)
The migration cost is a two-line change to your query:
POST /my_index/_search
{
  "query": {
    "knn": {
      "my_vector": {"vector": [0.1, 0.2, 0.3], "k": 100}
    }
  },
  "docvalue_fields": [{"field": "my_vector", "format": "binary"}],
  "_source": {"excludes": ["my_vector"]}
}
No reindexing. Works on all existing indexes regardless of when they were created. Compatible with every k-NN engine OpenSearch supports — Lucene, Faiss, NMSLIB — and every vector type (float, byte, binary). The gains scale with k: at k=1000, the server-side improvement is actually 14.7x because the fixed costs (the k-NN search itself, network round-trip) represent a smaller fraction of total time.
If your team runs RAG, semantic reranking, or any pipeline that fetches large result sets of vectors, this is the first thing to test after upgrading. The 70% payload reduction alone cuts egress costs on AWS-hosted clusters. Full benchmark methodology and workload-specific guidance are in the OpenSearch docvalue_fields deep-dive.
Prometheus Without the Migration
For teams already running Prometheus, the traditional OpenSearch setup created an uncomfortable choice: ship metrics into OpenSearch for unified storage, or keep them in Prometheus and maintain two separate dashboards. Migrating metrics meant duplicating data; keeping them separate meant context-switching whenever you needed to correlate a latency spike with an error rate.
OpenSearch 3.7 removes that choice. You can now connect OpenSearch Dashboards directly to your existing Prometheus instance as a datasource and query with PromQL alongside your logs and traces — no data migration, no parallel ingestion pipeline, no changes to your Prometheus deployment. Three things ship with this:
- Explore Metrics: A visual interface that auto-detects Prometheus datasources and generates valid PromQL as you navigate from metric name to labels to aggregation. Builder and raw editor stay in sync.
- Unified alerting: OpenSearch monitors and Prometheus alerting rules appear in a single inbox, sorted by severity, grouped by service. Alertmanager routing tree is rendered read-only for incident context.
- SLO catalog: Ranks every service-level objective by remaining error budget — the objective closest to breaching is always first. Includes burn-rate alerts and multi-window evaluation.
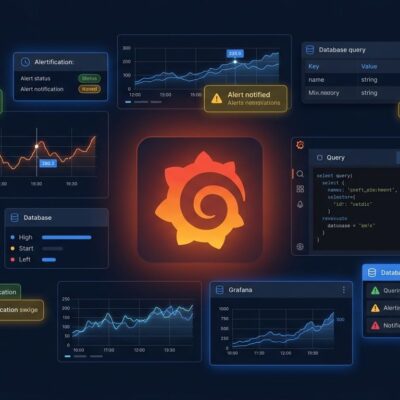
This is a direct challenge to Grafana’s position as the default observability UI. If your team already uses OpenSearch Dashboards for log and trace queries, you now have a credible path to consolidating your metrics view there too — without ripping out Prometheus. The OpenSearch Observability Stack page covers setup.
Two More Additions Worth Noting
The vector and Prometheus changes are the headlines, but two other features in 3.7 are worth knowing about.
ISM Simulate API: Index State Management policies are powerful and dangerous in equal measure. The new POST /_plugins/_ism/simulate endpoint lets you preview how a policy would affect your indexes — current state, transition conditions, projected next state — without touching anything on the cluster. Wildcard patterns and inline policy bodies work. Run it before you deploy anything.
Semantic and hybrid search endpoints: Previously, building hybrid search (BM25 + vector similarity) required generating embeddings client-side and constructing explicit neural queries. The new _semantic_search and _hybrid_search endpoints accept plain text and generate embeddings automatically using your configured model — less plumbing, same results. These endpoints are also wired into the conversational_v2 agent type, which reaches GA in 3.7 and adds multimodal inputs for AI agent memory.
Upgrade Path
The OpenSearch project reports no breaking changes in 3.7. The docvalue_fields improvement is purely additive — existing queries continue to work, and you opt in by updating your k-NN query parameters. The Prometheus integration requires only adding a datasource in Dashboards; nothing on the Prometheus side changes.
Full release notes and the announcement are on the OpenSearch 3.7 blog. Official k-NN vector field documentation and the hybrid search guide cover the full API surface for both features.