AI coding tools now write 41% of all code in 2026, and developers report feeling 20% faster. However, the latest developer productivity benchmarks tell a different story. Teams using AI are actually 19% slower due to longer review times and higher bug rates. Code churn is up 41%, and delivery stability has decreased 7.2%. As organizations spend $200 per engineer per month on AI tools, the 2026 benchmarks from Larridin, LinearB, and GetDX reveal what’s really happening to developer productivity—and the gap between vendor promises and reality is widening.
The Measurement Revolution
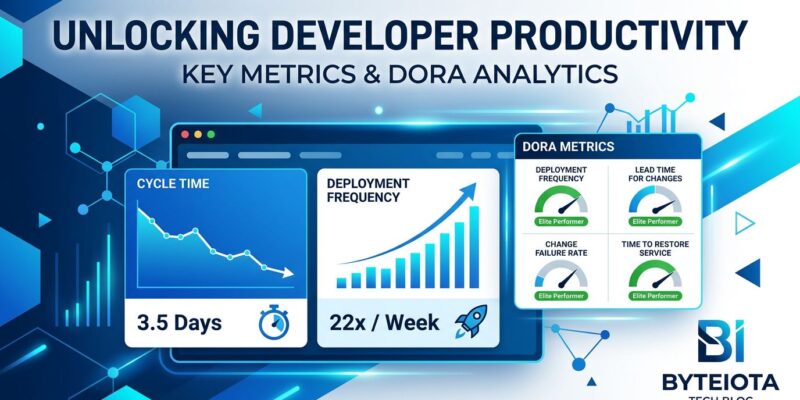
Developer productivity measurement has evolved dramatically. In 2020, teams tracked lines of code and commit counts. By 2023, DORA metrics (deployment frequency, lead time, change failure rate) became the standard. In 2026, the industry has converged on unified frameworks combining speed, quality, developer experience, and business outcomes.
The shift matters because single metrics are gameable and incomplete. The SPACE framework researchers put it bluntly: “Productivity cannot be reduced to a single dimension.” DORA’s own research found that speed and stability are correlated, not opposing forces—elite teams excel across all metrics while low performers struggle everywhere.
Three frameworks now dominate. DORA measures delivery speed and stability. SPACE captures five dimensions including satisfaction and well-being. DX Core 4 unifies both with business ROI tracking. Organizations need at least three dimensions measured simultaneously to avoid optimizing the wrong things.
The AI Productivity Paradox
Here’s what the 2026 data actually shows. Moreover, 84% of developers use AI coding tools. AI generates 41% of code worldwide. Developers feel 20% faster. Nevertheless, they’re actually 19% slower because AI-generated pull requests wait 4.6 times longer for review.
The quality problems are mounting. Code churn is up 41% with AI adoption. Additionally, 45% of AI-generated code contains security vulnerabilities. Code duplication is up 4x. GitClear’s analysis shows churn rates climbing from a 3.3% baseline in 2021 to 5.7-7.1% in 2024-2025, with the increase driven by “more copy/paste and less maintainable design.”
The safe threshold appears to be 25-40% AI code generation. This range delivers 10-15% actual productivity improvements while keeping quality gates effective. Above 40%, quality concerns outweigh speed benefits. Consequently, that’s why 75% of developers won’t merge AI code without manual review.
The data matters because organizations have invested heavily—$200 per engineer per month on average. Bottom-quartile teams see a 50% lead time reduction with AI, the biggest gainers. In contrast, top-quartile teams improve only 10-15% because they were already optimized. AI helps struggling teams catch up, but it’s not a magic bullet for elite performance.
Where Developer Time Actually Goes
Most engineers spend only 30-40% of their day writing code. Furthermore, the remaining 60-70% disappears into meetings (10 hours per week), context switching (20 hours per week), waiting on CI/CD, code reviews, and organizational overhead.
The interruption data is stark. Microsoft found 275 interruptions per day during core work hours—one every two minutes. Studies tracking actual developer workdays found 47 interruptions per day yielding just 2.3 productive hours out of eight. Meanwhile, digital workers toggle between apps and websites 1,200 times daily, roughly every 24 seconds.
Recovery cost is brutal. It takes 23 minutes to refocus after an interruption. For deep code work requiring mental models of complex abstractions, that extends to 20-40 minutes. Therefore, a single 30-minute meeting placed in the middle of an afternoon destroys the entire half-day for deep work.
The financial impact is measurable. Four hours per week lost to reorienting after app switching. That’s five work weeks annually, or 9% of yearly productivity, consumed entirely by digital tool navigation overhead. Specifically, per-developer cost: $50,000 per year. Industry-wide: $178 billion.
Context switching is the number one productivity killer—bigger than AI tooling, frameworks, or development process. Indeed, the gap between elite and average teams comes down to focus time protection. Top-quartile teams maintain 6+ hours of focus time daily. The industry median is 4.2 hours. That 2-hour gap separates elite performers from the rest.
What Elite Teams Do in Developer Productivity
The 2026 benchmarks reveal clear performance tiers. Elite teams ship pull requests in under 2 days. The industry median is 7-10 days. Similarly, elite teams deploy changes to production in under an hour from commit. Low performers measure lead time in weeks or months—a 208x gap, with elite teams deploying 10+ times daily while low performers ship less than once per month.
Delivery speed tells the same story. Elite teams ship software in under 22.5 days on average. Bottom-quartile teams take over 62 days, nearly a 3x gap. Sprint completion rates diverge similarly: elite teams complete over 67% of planned work, low performers less than 50%.
Flow efficiency separates winners from losers. Elite teams achieve over 40% flow efficiency. Low performers sit below 25%. Importantly, flow efficiency correlates directly with focus time protection, not individual developer skill.
The elite performance profile is consistent: 80%+ weekly AI tool usage, 60-75% AI-assisted code share (but quality-controlled within the 25-40% safe threshold for generation), sub-8-hour PR cycle times, code turnover ratios below 1.3x, 6+ hours of protected focus time daily, multiple deployments per day, and mean time to restore service as low as 7 minutes through automated recovery systems.
Elite teams don’t work harder. They work in environments optimized for flow.
The ROI of Developer Experience
Developer experience has transformed from a “soft metric” to a quantifiable business driver. The Developer Experience Index (DXI) is the first validated productivity measure directly linked to dollars. It tracks 14 factors influencing developer engagement and enables concrete ROI communication to leadership.
Each 1-point DXI gain equals 13 minutes per week saved per developer. At 100 developers, a 1-point improvement equals $100,000 per year in recovered productivity. That’s $1,000 per developer annually per DXI point.
Top-quartile DXI scores correlate with 4-5x higher performance across speed, quality, and engagement. Furthermore, a DXI score above 8.5 delivers 30% higher feature output. A 10% DXI improvement reduced attrition by 15% at one fintech firm. These are business outcomes, not morale surveys.
The data explains why 80% of large software engineering organizations are establishing platform teams in 2026, up from 45% in 2022. Platform engineering ROI is now provable with DXI metrics. CFOs demand data, and DXI provides the business case.
What to Measure and What to Ignore
Track cycle time from commit to production. Track lead time for changes. Track change failure rate and time to restore service. Track Developer Experience Index. Track daily focus time. Track flow efficiency. Track code turnover ratio to measure AI impact on quality.
Ignore lines of code, especially with AI generation making volume meaningless. Ignore commit counts and hours worked. Ignore story points completed in isolation. Ignore PR count as a vanity metric.
The 2026 benchmarks reveal uncomfortable truths. AI productivity gains are real but smaller than claimed, and quality-controlled adoption is essential. Context switching costs more than most organizations realize. Elite performance comes from process and environment, not heroics. Developer experience drives measurable business outcomes.
The data is available. The frameworks are proven. The question is whether organizations will measure what matters or keep optimizing metrics that don’t correlate with results.