 By ByteBot
Grafana Labs shipped four changes at ObservabilityCON 2026 on October 20 that move Grafana Cloud from a dashboarding platform into something closer to an agentic ops co-pilot. Agent Observability and Assistant Watchers are now generally available. Grafana Managed Sandboxes and Pages moved into public preview. Together, these close a loop that has frustrated every team running AI agents in production: from “something degraded” to “here is a proposed code fix,” without leaving Grafana.
Assistant Watchers Are Now GA — And Alert Rules Cannot Compete
Traditional alert rules have one structural problem: they only catch what you thought to define. A slow memory leak in a multi-step agent workflow, a gradual drift in tool call latency, an uptick in hallucination-adjacent completions — none of these fit neatly into a threshold. Watchers are designed for that gap.
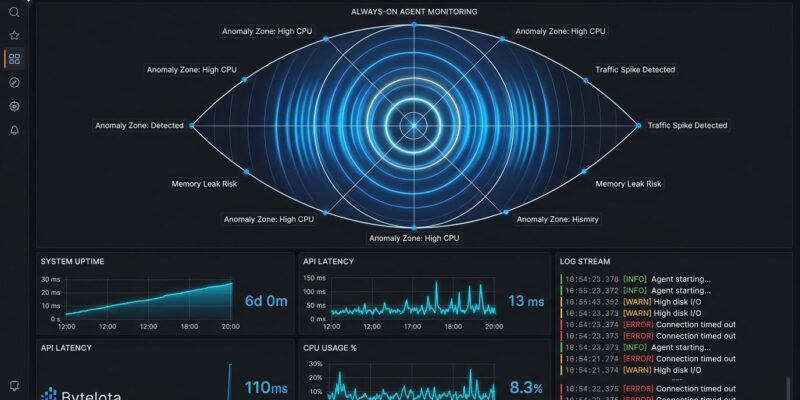
A Watcher is an always-on agent. You describe what matters in plain language — something like “flag if checkout completion rate drops against the Tuesday baseline” — and the Watcher learns normal patterns from your telemetry. It monitors Prometheus, Amazon Managed Service for Prometheus, Loki, Tempo, Pyroscope, BigQuery, CloudWatch metrics, and Synthetic Monitoring results. When patterns shift, it surfaces findings with evidence attached, routes them through your existing Grafana Alerting pipeline, and can trigger a full Investigation automatically.
The number Grafana is leading with: 63% reduction in mean resolution time compared to threshold-based alert rules alone. Watchers catch degradations before they cross a threshold, when they are still cheap to fix.
Auto-recalibration is the feature that makes this practical over time. As your system changes — new deployments, seasonal traffic shifts, infrastructure updates — Watchers adjust baselines without you stepping in. That is the part most anomaly detection tools skip, and it is why static thresholds quietly rot over months. Billing starts December 1, 2026, on Grafana Assistant token usage. No per-watcher fee, no per-run charge.
Agent Observability GA: OpenTelemetry Already Works
If 76% of organizations already invest in OpenTelemetry — and Grafana’s own 2026 State of Observability survey says they do — then the pitch for grafana agent observability is simple: your existing OTel pipeline gets AI agent telemetry for almost no additional setup.
Agent Observability tracks what matters for AI agent debugging: token usage split by input and output, cost per model, operation latency, time to first token, tool call success rate, and agent loop iteration counts. Six pre-built dashboards cover LLM metrics, vector database performance, MCP implementations, and GPU utilization. You get a cost view alongside a performance view — the combination that most custom dashboards forget to build until you get the bill.
Two instrumentation paths:
- OpenLIT SDK: A few lines of code, point the OTLP exporter at your Grafana Cloud endpoint. Works with all major LLM providers and agent frameworks.
- OpenLIT Operator on Kubernetes: Zero-code injection. The Operator instruments your workloads automatically — no changes to application code required.
Free tier: 30,000 generations per month and 25 million tokens per month. Pro starts at $1.50 per 1,000 generations. Grafana’s Agent Observability product page has the full breakdown and signup.
Managed Sandboxes (Preview): From Root Cause to Pull Request
This is the most ambitious of the four announcements. When an Investigation identifies a likely root cause, Grafana Assistant can now be directed into a Managed Sandbox — a controlled cloud environment where it clones your repository, reads the relevant code alongside live production telemetry, edits files, runs tests, and commits a proposed fix to a branch. The diff appears in the Grafana UI next to the investigation. You click “Create PR” if it looks right.
Grafana never merges. Grafana never deploys. Every proposed fix goes through five automated risk checks — deploy hazards, production impact, observability instrumentation breakage, sensitive telemetry exposure, and build validity — before it surfaces for human review. The design reflects what the 2026 State of Observability Report found: 85% of engineering leaders are comfortable with AI investigating incidents, but only 50% are comfortable with AI deploying changes. Grafana built to that exact comfort boundary.
Managed Sandboxes are in public preview. Documentation is live and access is available to request.
Pages (Preview): Describe Your Dashboard, Get an App
Grafana Pages replaces the fixed-grid panel model with conversational, app-like views. You describe what you need, refine it in chat, and get an interactive visualization closer to a product page than a monitoring dashboard. For teams managing multiple AI agents, the appeal is a unified cost and latency and quality view that pre-built dashboards never quite captured. Pages are in preview with no GA date announced.
What to Enable Today
Both GA features are available in Grafana Cloud now:
- Enable Agent Observability if you are running any LLM-powered workloads. The free tier covers most development environments. Use the Kubernetes Operator path if you want zero-code instrumentation.
- Set up a Watcher for your highest-stakes alert — something you have been monitoring with a threshold that you know misses edge cases. The Watchers documentation walks through the setup.
For previews: Managed Sandboxes are worth requesting access to now if your team responds to production incidents manually today. The full announcement guide — including the Knowledge Graph expansion and full-text search improvements — is at grafana.com/blog/observabilitycon-2026-announcements.