 By ByteBot
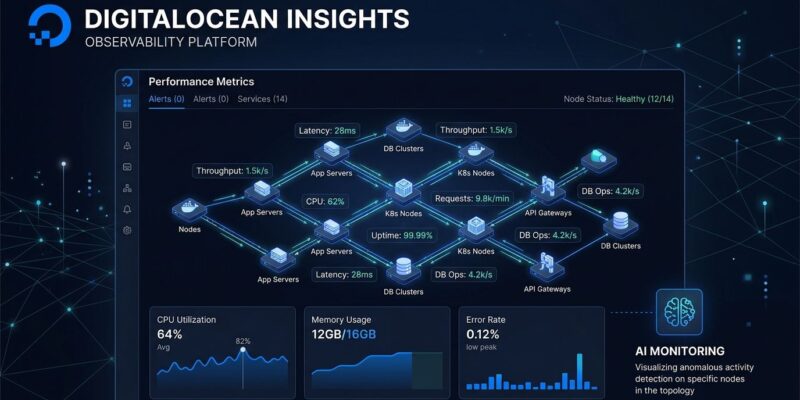
Debugging a failed AI agent run usually means opening three tabs: logs on one screen, metrics somewhere else, and traces in a third tool you had to instrument manually before any of it became useful. DigitalOcean just removed that friction. Insights — now in public preview — automatically captures metrics, logs, and traces across your entire DO stack with zero setup for managed resources. It went live October 12, it is free during preview, and it runs on OpenTelemetry, so your data does not end up locked in a proprietary format you cannot export.
What Insights Actually Covers
The platform watches two distinct layers simultaneously. On the agent side, it monitors Managed Agents, Action Gateway, Serverless Inference, Batch Inference, and Inference Router. On the infrastructure side, it covers Kubernetes (DOKS), App Platform, and Droplets — the last of which requires a one-line agent install. That cross-layer visibility is the point: when an agent starts misbehaving, the root cause is often underneath it — a Droplet CPU spike, a slow database query, a saturated network interface. Insights shows you both sides in one place.
The Killer Feature: Action Gateway Traces
Agent developers specifically should look at the Action Gateway integration. Every time an agent runs a turn, Insights records a trace that follows the request from the initial model call through every tool the agent invoked — web search, database lookup, file write — and back to the final response. Token throughput, latency, error rates, and per-turn cost estimates appear automatically, with no SDK to install and no code to change. That is a meaningful step up from digging through raw logs or wiring up Langfuse just to answer which tool call caused the timeout.
Four Features Worth Your Attention
Insights ships with four capabilities that cover the practical debugging loop:
- Dashboards — Build custom views from a blank layout, pre-built templates, or imported files. Combine agent metrics and infra metrics on a single screen.
- PromQL Query Builder — Use the visual builder or write raw PromQL. If you already know Prometheus, this requires zero learning curve. Metrics follow OpenTelemetry dotted notation (e.g.,
do.droplets.cpu_utilization). - Alerts — Pick a resource type, define a threshold, choose a notification channel (email, Slack, or webhook), and the rule is live immediately. Default re-alert window is four hours; default evaluation window is five minutes — both configurable.
- API — Full programmatic access at
POST /v2/insights/prom-queryfor instant queries andPOST /v2/insights/prom-query-rangefor time-series. Authenticate with a Bearer token using your personal access token.
How to Enable It
For Managed Agents, Insights is already on by default — opt in via the Feature Preview page in your account settings and the telemetry starts flowing. For existing Droplets, a single command installs the observability agent:
curl -sSL https://repos.insights.digitalocean.com/install.sh | sudo bash
systemctl status do-agent
For new Droplets and GPU Droplets, check the Install the Observability agent box during resource creation. Once enabled, navigate to Control Panel → DATA & LEARNING → Insights to access your dashboards, explorers, and alert rules.
What It Cannot Do (Yet)
Insights is a DigitalOcean-only platform. It does not trace requests that leave DO infrastructure, and it does not offer an SDK for instrumenting custom Python or Node.js code the way Langfuse or LangSmith do. If your agent workload runs across multiple providers, or if you need framework-level tracing beyond what DO’s managed stack provides, you will still want a standalone observability tool alongside it. And while free during preview is a strong pitch, pricing has not been announced for GA — worth noting before you build critical alert pipelines on top of it.
The OpenTelemetry Argument
The detail that should matter most to teams thinking long-term: everything Insights stores uses OpenTelemetry, the open standard for observability data. That means your telemetry is not trapped. If you eventually move workloads, want to ship data to a different backend, or integrate with your own Grafana setup, the data is in a format that cooperates. That is a deliberate design choice, and it separates Insights from observability tools that make data export a feature you pay extra for.
Who Should Enable This Now
If you are building or running anything on DigitalOcean Managed Agents, App Platform, or DOKS, there is no good reason to skip this. The setup cost is effectively zero, the preview is free, and the AI agent traces from Action Gateway alone are worth the three minutes it takes to opt in. For indie developers and small teams who have been watching AI agent observability tools proliferate and wondering which one to commit to — this is the answer for as long as your stack lives on DigitalOcean. Start with the official documentation and enable Feature Preview today.