 By
By Anthropic just opened a public beta that sends first-party OpenTelemetry traces from Claude’s Messages API, Managed Agents, and SDKs directly into any OTLP-compatible observability backend. If you build with Claude and have ever stared at a 38-second agent run wondering which model call, tool execution, or MCP server ate your latency — that problem now has a native fix.
The announcement landed today via @ClaudeDevs: “Claude Platform can send OpenTelemetry traces from the Messages API, Claude Managed Agents, and the Claude SDKs to your observability stack.” Coverage spans every part of the stack that actually matters: individual API calls, full agent sessions, and tool executions.
Why First-Party Matters
Teams have been instrumenting Claude with community wrappers like openinference-instrumentation-anthropic and claude_telemetry. Those tools work by monkey-patching the SDK. The problems are predictable: they lag behind SDK updates, they cannot see into Managed Agents infrastructure, and every new Claude release means waiting for the wrapper maintainer to catch up.
Native OTel from Anthropic changes the math. Latency is measured at the platform level, so the numbers are authoritative. Managed Agent turns, tool calls, and MCP server calls appear as spans automatically — no custom instrumentation needed. The span schema follows the OpenTelemetry GenAI semantic conventions, meaning it plugs into whatever pipeline you already have.
Two Ways to Enable It
There are two independent setup paths. Use one, both, or combine them to see SDK and API spans in a single trace.
Route 1: Claude Console
In the Console’s OpenTelemetry settings, choose “Add destination.” You will need the organization admin role. Enter your OTLP/HTTP endpoint (HTTPS, port 443) and any authentication headers. Presets exist for Datadog, Honeycomb, Grafana Cloud, Langfuse, Braintrust, Arize, Sentry, and custom OTLP. Pick metadata-only or full-content mode, select which workspaces to cover, and you are done. No code changes required.
Route 2: SDK Tracer Provider
Register an OpenTelemetry tracer provider before instantiating your Anthropic client. The Claude SDK picks it up automatically. Python example:
from opentelemetry import trace
from opentelemetry.exporter.otlp.proto.http.trace_exporter import OTLPSpanExporter
from opentelemetry.sdk.trace import TracerProvider
from opentelemetry.sdk.trace.export import BatchSpanProcessor

provider = TracerProvider()
provider.add_span_processor(
    BatchSpanProcessor(OTLPSpanExporter(
        endpoint="https://your-backend:443/v1/traces",
        headers={"Authorization": "Bearer YOUR_TOKEN"},
    ))
)
trace.set_tracer_provider(provider)

# Now create your Anthropic client as normal
import anthropic
client = anthropic.Anthropic()
The same pattern works in TypeScript, C#, Go, Java, PHP, and Ruby. For the Claude Agent SDK, three environment variables are sufficient:
CLAUDE_CODE_ENABLE_TELEMETRY=1
OTEL_TRACES_EXPORTER=otlp
OTEL_EXPORTER_OTLP_ENDPOINT=http://localhost:4318
What You Get in the Traces
The Claude Platform emits three OpenTelemetry signals, not just traces:
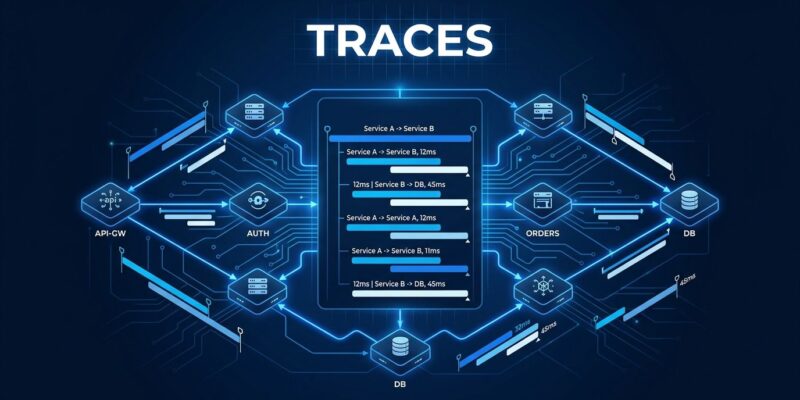
- Traces — every model request and tool execution as a span, with latency, status, and a full span hierarchy showing parent-child relationships between agent turns and tool calls
- Metrics — input tokens, output tokens, cache read tokens, and USD cost per call
- Log events — structured audit trail for prompts and tool results
Content mode controls what lands in the spans. The default is metadata-only: timing, status, token counts, model name, agent and tool names. Switch to full content to capture prompts, responses, and tool I/O — up to 0.75 MB per span, which covers a 200k-token context window. When a span exceeds the limit, the system prompt and oldest messages are dropped first, and the anthropic.content.truncated flag is set.
Span attributes follow the GenAI semantic conventions. The key ones: gen_ai.system = anthropic, gen_ai.operation.name (chat, invoke_agent, or execute_tool), gen_ai.request.model, and gen_ai.tool.name for tool calls. Span names follow the pattern {operation} {model}, so a Sonnet call shows up as “chat claude-sonnet-5-5” in your trace viewer.
Supported Platforms
Twelve observability platforms have dedicated setup guides: Datadog, Grafana Cloud, Honeycomb, Langfuse, Braintrust, Arize, Sentry, Splunk, PostHog, New Relic, LangSmith, and any custom OTLP endpoint. If your stack accepts OTLP, it works. Anthropic’s official OpenTelemetry documentation covers each platform’s exact configuration.
Enable This Now
Third-party instrumentation was the workaround. This is the real thing.
AI agents fail in production for specific, traceable reasons — a tool returning malformed JSON, a model call timing out, an MCP server going dark. The difference between a 30-minute debug session and a 3-hour one is whether you had traces when it happened. The Console route takes five minutes and requires zero code changes. Enable it before your next incident, not after.
The feature is in public beta, so the span schema may evolve. Check the MLflow guide for Claude OTel tracing for a practical walkthrough, and watch the Claude Platform release notes for updates as this moves toward GA.