LinearB’s 2026 Software Engineering Benchmarks Report analyzed 8.1 million pull requests from 4,800 engineering teams across 42 countries—the largest empirical dataset of developer productivity ever published. The data establishes industry-wide performance baselines: median teams average 4.2 hours of focus time daily, 3.8-day lead times, and 12.4 merged PRs per month. Elite teams achieve less than 105 lines per PR, sub-48-hour cycle times, and over 6 hours of protected deep work.
Most importantly, the report exposes a critical gap between AI tool adoption and actual performance. While 92% of developers use AI assistants claiming 25% productivity boosts, AI-generated PRs show 1.7 times more issues and wait 4.6 times longer for review. With 80% of organizations adopting platform engineering by 2026 and executives demanding ROI dashboards tying DORA metrics to revenue, these empirical benchmarks provide the evidence base engineering leaders have lacked.
Elite Team Standards: The Performance Bar Just Got Concrete
The 8.1M PR analysis establishes elite team benchmarks for the first time: less than 105 lines per PR, over 5 PRs per week per developer, sub-48-hour cycle times (best teams hit under 25 hours), over 6 hours of focus time daily, and under 2% rework rates. This compares to median organizations averaging 83-hour cycle times and 4.2 hours of focus time—a measurable gap between good and great.
PR size emerges as the most significant driver of velocity across the entire lifecycle. Elite teams keep changes under 105 lines, enabling faster reviews (under 3 hours versus days for large PRs), safer merges, and lower change failure rates. Consequently, small PRs get picked up fast, reviewed efficiently, and merged confidently. Large PRs sit idle, accumulate conflicts, and introduce more bugs.
Engineering leaders can finally answer “Is my team’s 120-hour cycle time good or bad?” with data. The benchmarks enable evidence-based performance assessment, identify specific bottlenecks (if your PR size is 300 lines while elite teams do under 105, that’s your leverage point), and justify process improvements or tooling investments with concrete before-after targets.
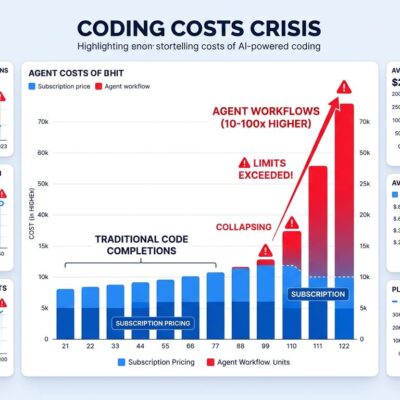
The AI Productivity Paradox: More Output, More Problems
AI-generated code creates a quality-velocity trade-off that benchmarks now quantify. AI PRs contain 1.7 times more issues overall (10.83 issues versus 6.45 for human code), with critical issues up 40%, logic errors up 75%, and readability problems tripling. Moreover, AI PRs wait 4.6 times longer for review—though once picked up, reviews complete twice as fast as reviewers scrutinize efficiently.
The numbers directly challenge vendor marketing. Ninety-two percent of developers use AI tools claiming 25% productivity boosts, yet PR volume increased 20% while incidents surged 23.5%. At the 90th percentile, AI PRs reach 26 issues per change—more than double the human baseline. Security concerns run 1.5 times higher in AI-generated code. Acceptance rates tell the real story: 32.7% for AI PRs versus significantly higher for manual code.
This isn’t about rejecting AI tools—it’s about measuring reality versus perception. Organizations need to track AI code performance separately, set stricter review SLAs addressing the 4.6x pickup delays, and balance the volume increase against quality controls. The “surprisingly misunderstood” productivity measurement problem extends directly to AI adoption. Developers feel faster while teams see quality declines.
Beyond Velocity: Why DORA + SPACE Beats DORA Alone
The industry is shifting from DORA-only measurement to combined DORA + SPACE frameworks because velocity metrics alone create dangerous blind spots. Teams can achieve “Elite” DORA status (deployment frequency, lead time, change failure rate, MTTR) through burnout, skipped documentation, and technical debt accumulation—patterns that work short-term but cause long-term collapse.
SPACE adds five dimensions velocity metrics miss: Satisfaction and well-being, Performance, Activity (with context), Communication, and Efficiency and flow. Nicole Forsgren, co-creator of both frameworks, puts it simply: “DORA shows how efficiently your team moves code. SPACE shows how sustainably that code gets written. You need both.”
The DX Core 4 Framework proves the point—360+ organizations achieved 3-12% efficiency gains, 14% R&D focus increases, and 15% developer engagement improvements by balancing speed with sustainability. Furthermore, focus time data reinforces this: median teams get 4.2 hours while elite teams protect 6+ hours of deep work. The velocity trap is real—high deployment frequency means nothing if your team burns out in six months.
Translating Metrics to Money: What Executives Actually Care About
Executives don’t care about deployment frequency—they care about revenue impact. Successful platform engineering teams translate technical metrics into CFO language: a 100-person engineering team wasting 4 hours weekly on environment setup equals $1.5M in annual lost value. At $150K per developer, a 10% productivity gain equals $15K per developer annually—$1.5M for a 100-person team. Additionally, context switching costs $50K annually per developer.
Platform engineering delivers measurable business outcomes: 30% faster software delivery, 40% faster updates with IDPs, and roughly 50% reduced operational overhead. Moreover, McKinsey research shows organizations using balanced measurement achieved 60% improved customer satisfaction and 20-30% reduced defects. These aren’t vanity metrics—they’re board-level KPIs.
With 80% of organizations adopting platform engineering, justifying $2M+ investments requires more than “better deployment frequency.” The benchmark-based ROI calculations enable engineering leaders to secure budget, demonstrate value, and tie technical improvements to business outcomes executives understand. Transform “we reduced cycle time by 40 hours” into “we shipped features 2 weeks faster, capturing $500K additional Q4 revenue.”
Start Here: Compare, Measure, Optimize
Compare your team against benchmarks: Is your cycle time 83 hours (median), 58 hours (fast quartile), or 124+ hours (red flag territory)? Measure AI code separately—track acceptance rates, review times, and incident patterns to quantify actual versus claimed productivity gains. Implement small PR workflows enforcing the sub-105-line standard that elite teams follow.
Use DORA + SPACE together, not DORA alone. Translate improvements to dollars for executive dashboards. Avoid vanity metrics like lines of code or commit counts—they incentivize wrong behaviors and make real productivity worse. Therefore, focus on outcome metrics (cycle time, quality, focus time) rather than activity metrics that developers game.
The 8.1M PR dataset replaces gut feel with evidence. Engineering productivity was “surprisingly misunderstood”—now it’s measurable, comparable, and improvable. The benchmarks exist. The frameworks work. The ROI is quantifiable. The gap between your team and elite performance is knowable. Start measuring.