 By
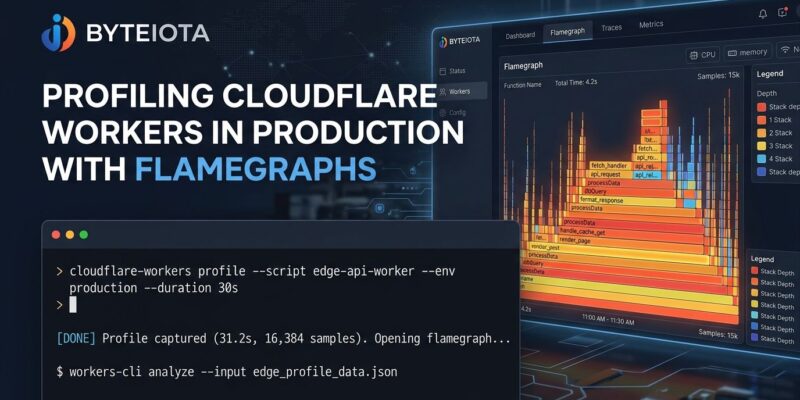
The biggest complaint about running production code on Cloudflare Workers has always been the same: you cannot see inside it. Workers run in ephemeral V8 isolates that spin up in under five milliseconds, handle a request, and disappear — no persistent process to attach a profiler to, no filesystem to grep, no flamechart to stare at while your memory climbs. On October 9, Cloudflare changed that. Workers and Durable Objects now support on-demand CPU and memory profiling via interactive flamegraphs, accessible from the dashboard, the CLI, or the API — against live traffic, no code changes required.
What You Can Do Now
Trigger a CPU or heap profile of a deployed Worker while it serves real requests. No redeploy. No added console.time() calls sprinkled across your codebase. Choose a capture window between 1 and 50 seconds (default is 10), and the platform streams back a pprof file while your Worker keeps serving traffic. The Cloudflare dashboard renders the result as an interactive flamegraph — every rectangle is a function call, width represents CPU time or memory allocations, and you can click through the call stack. Download the pprof file if you prefer Go’s pprof tool or Chrome DevTools.
Three ways to trigger a capture:
- Dashboard: Workers & Pages → select your Worker → Observability → switch the view to Flamegraph, choose CPU or Heap, set duration
- CLI: see the command below
- API: REST endpoint for programmatic workflows
cf workers versions profile latest --worker-id "$WORKER_NAME" --duration-ms 10000 --profile-type cpu > worker-cpu.pprofOne constraint before you run it: the Worker must already be active and receiving real traffic during the capture window. Profiling does not generate synthetic requests or wake a sleeping isolate. This is the one hard limit, and it matters especially for Durable Objects — the specific DO instance must be alive and handling requests at capture time.
Two Real Bugs Cloudflare Found With It
The announcement includes two internal case studies. Both are worth reading because they illustrate what this tooling actually catches — and what it catches is not always what you expect.
The Prometheus false-negative. An internal Worker’s P999 memory was sitting at 133 MB against the 128 MB per-isolate hard limit, causing regular “Exceeded Memory” evictions. The team had a feature flag they believed disabled Prometheus instrumentation. It had disabled the data export, not the allocation code underneath it. A heap profile showed Prometheus accounting for 66.7% of all memory allocations — from code everyone thought was off. Removing the dead path dropped P999 to 118 MB. The lesson is not just “profile to find leaks.” It is that code you believe is disabled can still be your largest memory consumer, and logs will not tell you this.
The recursive JSON replacer. A CPU profile of Cloudflare’s own R2 binding Worker showed a recursive JSON replacer consuming over 5% of CPU time — visible as a wide column in the flamegraph. At a 30-second CPU budget on paid Workers, 5% is 1.5 seconds per request. After optimization, the function runs 2.7x faster.
Why This Required a Runtime Change
Traditional profilers attach to a persistent process. Workers isolates do not persist — they spin up, handle a request, and freeze or get discarded. There was no prior attach point. Cloudflare built the profiling collection layer directly into the isolate runtime, capturing sample data during live execution and streaming it back without requiring process persistence. That is the architectural reason this feature did not exist before, and it is also why local wrangler dev cannot replicate it — the bottlenecks that matter appear under real production traffic patterns.
For comparison: AWS Lambda has no native production profiling and requires X-Ray plus manual instrumentation. Vercel Edge Functions have no equivalent feature as of this writing. Node.js on a traditional server has had this capability for years. Cloudflare Workers now matches it.
The Verdict
Production observability has been the last major gap between edge compute and traditional server-side runtimes. This closes it for CPU and memory. If you are running Durable Objects in production with non-trivial load and have not profiled them, you are making assumptions you cannot validate. Start with a heap capture on your highest-traffic DO. The official profiling docs cover the full CLI reference and API spec.