 By ByteBot
This week, IEEE Spectrum synthesized the most comprehensive autonomous vehicle safety dataset ever compiled: Waymo’s robotaxis have logged 220.6 million rider-only miles across five US cities and produced a 94% reduction in crashes causing serious injury or death compared to human drivers operating in those same cities. An independent Insurance Institute for Highway Safety study, released in July, puts a second number on it — 68% fewer crashes per mile, 81% fewer injury crashes overall. The autonomous vehicle safety data is no longer preliminary. Within their operational domain, self-driving cars are dramatically safer than human drivers.
What the Autonomous Vehicle Safety Data Actually Shows
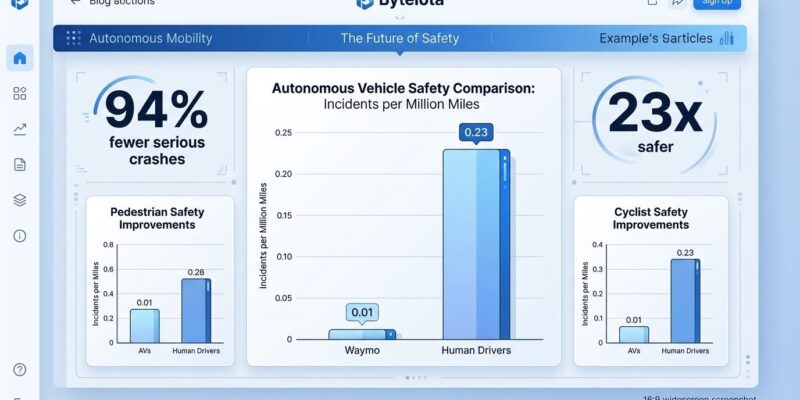
Waymo publishes granular crash statistics across Phoenix, San Francisco, Los Angeles, Austin, and Atlanta. The headline figure — 94% fewer serious-injury crashes — comes from comparing Waymo’s incident rate per million miles (0.01) against the human benchmark in those same cities (0.23). That’s a 23x gap, not a marginal improvement. For any-injury crashes, Waymo logs 0.71 incidents per million miles versus 3.91 for human drivers. For airbag-deploying crashes, 0.30 versus 1.68.
Vulnerable road users benefit most. Waymo’s safety data shows a 93% reduction in pedestrian injury crashes and 84% reductions for both cyclists and motorcyclists. Notably, 41% of all Waymo collisions involved less than 1 mph velocity change — minor contact events, not the crashes that kill people. A typical driver covering those same 220.6 million miles in Atlanta would statistically have been involved in roughly 1.2 serious-injury crashes. Waymo had zero.
IIHS Confirmed It — Independently
The Insurance Institute for Highway Safety is funded by auto insurers, not by Waymo. They analyzed 50 million Waymo miles against 222 billion human-driven miles across the same four cities. Their conclusion: 68% fewer crashes per mile, 85% fewer single-vehicle crashes, 81% fewer injury crashes. This is the same organization that publishes crash-test results automakers sometimes wish would disappear. Their imprimatur matters.
The city-by-city breakdown reveals real variance. Phoenix showed a 76% lower crash rate, LA showed 71%, San Francisco 35%. Austin was the outlier — Waymo’s crash rate there was 4% higher than human drivers, though IIHS attributes this to small sample size. That Austin exception is worth noting precisely because it’s included in the data. A team cooking results wouldn’t leave it in.
The Critics Aren’t Wrong — They’re Missing the Point
The legitimate criticism of these studies is about comparability, not fabrication. Waymo operates in geofenced, mapped cities in favorable weather conditions. Half of Waymo’s crashes occurred on streets with speed limits under 25 mph — but only 8% of human crashes happen at those speeds. Slow urban streets are inherently lower-risk. Additionally, roughly 50% of human-driver crashes go unreported in police databases, which paradoxically makes Waymo’s relative performance look even better than the actual comparison warrants.
IIHS lead researcher Eric Teoh was direct: “The present data collection system isn’t good enough to allow continuous monitoring of a large-scale expansion.” The existing evidence proves Waymo is safer within its Operational Design Domain. It does not yet prove that safety scales to Montana winters, rural highways, or cities Waymo hasn’t mapped. However, the argument that current data is too cherry-picked to be meaningful fails — the improvement within Waymo’s ODD is so large, and so consistently validated by independent researchers, that dismissing it requires ignoring the evidence.
Why This Matters Beyond the Tech Story
Approximately 37,000 Americans died in traffic crashes last year. The NHTSA attributes 94% of serious crashes to human driver error — recognition failures, bad decisions, impaired driving. Fatal crashes cost the US economy $417 billion annually in direct costs and nearly $1.85 trillion when quality-of-life losses are factored in. The AV safety data isn’t a technology benchmark. It’s an argument about how many preventable deaths are acceptable while we wait for a perfect solution.
Key Takeaways
- Waymo’s 220.6 million autonomous miles produced a 94% reduction in serious-injury crashes versus human drivers — a 23x gap in incidents per million miles
- The IIHS independently confirmed 68% fewer crashes and 81% fewer injury crashes per mile — using their own methodology against 222 billion human-driven miles in the same cities
- The methodology critique is valid: Waymo operates in favorable conditions, and the US lacks standardized AV crash reporting. But the improvement within Waymo’s current domain is too large to dismiss
- The Austin anomaly — 4% higher crash rate than humans — is published in the data honestly, which makes the rest more credible, not less
- 37,000 annual US traffic deaths and $1.85 trillion in yearly costs frame why this data demands serious policy attention, not just tech coverage