 By ByteBot
Adding observability to a Kubernetes cluster sounds straightforward until you actually do it. You can instrument every service with an SDK — which means touching every codebase, managing per-language libraries, and convincing every team to add spans to their code. Or you accept the blind spots. OpenTelemetry eBPF Instrumentation (OBI) is a third option: deploy one DaemonSet per node, and every pod on that node gets distributed traces and RED metrics automatically. No code changes. No restarts.
OBI hit beta at KubeCon EU 2026 and is targeting a stable 1.0 release by the end of the year. If you run Kubernetes and have services that lack observability coverage — especially Go, Rust, or C++ binaries that are painful to instrument manually — it is worth evaluating now.
Where OBI Came From
OBI is not a brand-new project. It is Grafana Labs’ Beyla project, donated to the OpenTelemetry community at GrafanaCON 2025. Grafana built Beyla because they needed application-level telemetry for compiled languages without requiring recompilation — a problem that affects any team running production Go or Rust services. The project spent two years evolving from basic HTTP instrumentation to distributed tracing, SQL support, and network metrics before the donation.
The OpenTelemetry eBPF SIG launched in May 2025, now co-maintained by Grafana Labs, Splunk, Coralogix, and Odigos. Splunk’s official beta announcement at KubeCon EU 2026 was the inflection point for enterprise adoption. Grafana’s Beyla continues as a downstream commercial distribution with Grafana Cloud integrations, while OBI is the vendor-neutral upstream.
How It Works
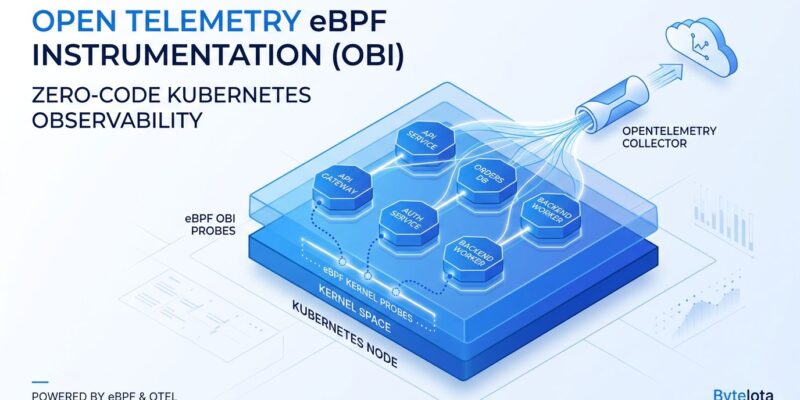
OBI runs as a DaemonSet on each node. It attaches small eBPF probes to the Linux kernel, which intercept network traffic and system calls without running inside your containers or modifying your application binaries. A Go-based userspace agent processes the raw kernel events, reconstructs application-layer protocol traffic, and emits OpenTelemetry-compatible spans and RED metrics (Rate, Errors, Duration) to your existing OTel collector.
The coverage is broad. OBI instruments HTTP/HTTPS, HTTP/2, gRPC, PostgreSQL, MySQL, Redis, MongoDB, Kafka, GraphQL, and Elasticsearch — across Go, Rust, Python, Java, .NET, Node.js, C/C++, and Ruby — without any per-service configuration. One DaemonSet per node covers every pod running on that node.
Deploy It Now
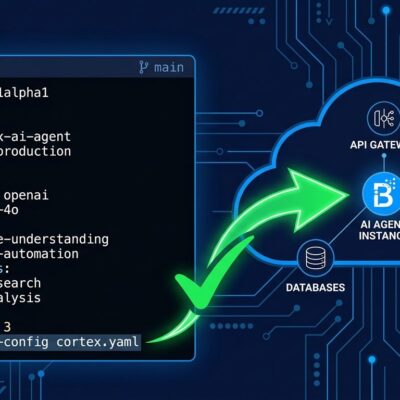
The easiest path is Helm. Check the official Kubernetes Helm deployment guide for the full values reference, but the default install is one command:
helm install obi -n obi --create-namespace open-telemetry/opentelemetry-ebpf-instrumentationRequirements before you deploy:
- Linux kernel 5.8 or newer (RHEL-family distributions support 4.18+)
- BTF (BPF Type Format) enabled in the kernel
- amd64 or arm64 node architecture
- The DaemonSet needs
hostPID: trueand two capabilities:BPFandSYS_PTRACE
Set OTEL_EBPF_KUBE_METADATA_ENABLE: autodetect and OBI will automatically discover pods and enrich spans with Kubernetes metadata. No per-app annotation required.
OBI vs SDK Instrumentation
The honest take: OBI does not replace SDK instrumentation. It replaces the blank spots SDK instrumentation leaves behind.
OBI gives you protocol-level traces — HTTP request and response spans, database query timings, queue publish latencies. An OTel SDK gives you application-level traces — Spring handler boundaries, Hibernate transaction spans, custom business logic. Both are useful. Neither is sufficient alone.
Use OBI for immediate baseline coverage across all services, especially legacy binaries and third-party workloads you cannot touch. Use SDK instrumentation for services where you need custom spans, internal application context, or richer trace detail. OBI automatically detects running OTel SDKs and disables its own tracing for those processes to avoid signal duplication — so you can run both without conflict. Grafana’s own analysis recommends the hybrid approach as the production default.
What Is Still Missing
OBI is beta, and three things need to land before the stable 1.0 release targeted for late 2026:
- JSON Schema-based configuration with per-service and per-process targeting
- Consistent telemetry schema labeling that aligns OBI signals with SDK signals in the same dashboards
- Formal production-readiness validation with defined test coverage thresholds
The current beta is usable in production, but configuration fields can change between releases. If your team needs semver stability guarantees, wait for 1.0. If you want to evaluate coverage and influence what the roadmap prioritizes, start testing now.
The Verdict
OBI solves the instrumentation coverage problem for Kubernetes clusters in a way that SDK-first approaches cannot: it works across every language and runtime without touching your code. The Helm install takes minutes. The tradeoff is protocol-level visibility rather than application-level insight — which is a reasonable first layer for services that currently have no observability at all.
The 1.0 GA timeline is close enough to plan around. Deploy OBI in a staging cluster now, evaluate the coverage you get, and decide which services still warrant SDK instrumentation on top. The approach the OTel team recommends — and Grafana’s own data supports — is running both together.