
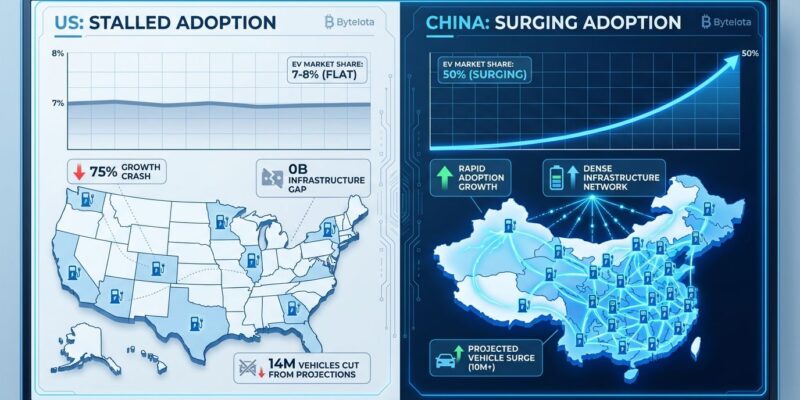
The US electric vehicle market has stalled. After hitting 40% year-over-year growth in 2023, EV adoption rates crashed to just 10% in 2024—a 75% collapse in growth rate. Market penetration has flatlined at 7-8% for four consecutive quarters while China surged past 50% and now controls 60% of global EV sales. BloombergNEF made an unprecedented move: for the first time ever, the firm revised its global EV outlook downward, slashing 14 million vehicles from its 2030 projections.
For developers working in automotive tech, infrastructure software, or making investment decisions in the EV sector, these numbers signal a fundamental market reality check. The “EV revolution” narrative has collided with infrastructure bottlenecks, policy rollbacks, and economic barriers that software alone can’t solve.
The Growth Crash Nobody Predicted
The numbers tell a stark story. US EV sales grew 40% year-over-year in Q4 2023, reaching 1.2 million vehicles and capturing 7.6% of the market. Industry analysts predicted continued acceleration. Instead, 2024 projections show electric vehicle growth collapsing to just 10%—a 75% decline in momentum. Worse, market penetration hasn’t budged: four consecutive quarters stuck at 7-8%, from Q3 2023 through Q2 2024.
Meanwhile, China’s EV market hit 50% penetration in early 2025, with some months reaching 51%. The country now accounts for 60% of global EV sales and is projected to sell over 14 million electric vehicles in 2025—more than the entire global total in 2023. The contrast couldn’t be sharper: China surging, America stagnating.
For infrastructure software developers building charging network APIs, fleet management platforms, or grid optimization tools, this stagnation matters. Slower adoption means slower customer acquisition, longer ROI timelines, and fundamental questions about market sizing. Companies like ChargeLab, Ampcontrol, and AMPECO built business models on exponential EV growth curves. Those curves just flattened.
BloombergNEF’s Historic Reversal
When industry analysts reverse multi-year projections, markets listen. BloombergNEF—the authoritative voice on EV forecasting—cut its global EV outlook for the first time in the firm’s history. The revision removes 14 million vehicles from 2030 sales projections, with US passenger EV sales now expected to reach only 4.1 million annually by decade’s end, down from the previous 5.7 million forecast.
The cause? Direct and unambiguous: “The roll-back of federal fuel-economy standards, the phase-out of the EV tax credit, and the potential removal of California’s ability to set its own air quality standards result in a notable decline in EV adoption in the US, impacting global adoption rates,” BloombergNEF stated.
This isn’t speculation—it’s analysts admitting their growth assumptions were wrong. For developers, this signals that EV infrastructure software demand will grow slower than venture-backed companies promised investors. The land grab for charging network dominance just got a lot less urgent.
Policy Whiplash: Tax Credits Vanish, Penalties Loom
The federal EV tax credit—$7,500 for new vehicles, $4,000 for used—expired on September 30, 2025, eliminated by the One Big Beautiful Bill Act passed in July. Princeton University’s Zero Lab analyzed the impact: EV sales could drop 30% by 2027 and 40% by 2030 compared to maintaining the credits. Manufacturing suffers too: up to 100% of planned EV assembly plant expansions could be canceled, and battery cell production capacity faces 29-72% redundancy.
Yet California is moving the opposite direction. The state’s Advanced Clean Cars II regulation, effective 2026, imposes $20,000-per-vehicle penalties on automakers who miss strict EV quota targets. Automakers and infrastructure developers are caught in regulatory whiplash—federal government withdrawing support while California tightens mandates.
The replacement incentive—a $10,000 auto loan interest deduction for US-assembled vehicles purchased between 2025 and 2028—applies to both EVs and internal combustion engines, offering no EV-specific advantage. Some states maintain their own incentive programs, but the patchwork of policies creates planning nightmares for infrastructure developers trying to forecast charging network buildout across regions.
The $250,000-Per-Site Infrastructure Bottleneck
Even if demand were strong, infrastructure can’t keep pace. The US needs 130,000+ high-speed EV chargers by 2030 to support 35% market penetration, according to PWC estimates. Today, there are only 37,000. Each charging site costs $250,000-$300,000 to deploy, and that’s before grid upgrades.
Speaking of grids: California alone requires $6-20 billion in distribution system upgrades by 2045. Home-charging feeders need 16 GW of added capacity ($3.9-12.9 billion), while public-charging feeders require 9 GW ($2.2-7.1 billion). Peak electricity demand increases 25% with forecast EV adoption, and 50% in a full electrification scenario. Home-charging-dominated feeders overload at twice the rate of commercial areas, creating spatial bottlenecks in residential neighborhoods.
Here’s where software developers might make a difference. Smart charging algorithms that distribute load across off-peak hours can reduce infrastructure upgrade costs by approximately 10%. Demand-shifting strategies that allocate charging to locations with more grid capacity headroom achieve similar savings. Workplace charging, when feasible, can eliminate congestion entirely in some scenarios. But these are optimization plays on limited infrastructure, not solutions to the fundamental buildout problem.
The challenge for developers is that utilities often fail to provide timely grid capacity data, and some regions see electricity prices spike above economic levels for commercial charging sites. You can’t optimize infrastructure you can’t measure, and you can’t deploy chargers where the grid can’t support them. Software has limits when hardware is the bottleneck.
The China-US Tech Divide
This isn’t just an automotive story—it’s a pattern. China dominates solar panel manufacturing. Chinese companies control battery supply chains. China led 5G infrastructure deployment. Now, EVs: 50% domestic penetration, 60% of global sales, 14 million vehicles expected in 2025 alone. The US sits at 7-8% penetration, stagnant for four quarters.
For developers, this creates a strategic choice. The Chinese market offers scale and growth (60% of global sales), but comes with language barriers, regulatory complexity, and geopolitical risks. The US market is familiar but stalling, with near-term uncertainty (2025-2030) and long-term potential only if policy stabilizes post-2030. Europe offers middle ground: ~23% penetration, steady policy support, smaller but reliable growth.
Career decisions in EV infrastructure software should factor in this divide. Companies focusing exclusively on US deployments face a harder path than those building globally or prioritizing Asian markets. The hype around US EV adoption was premature; the infrastructure and policy foundations weren’t in place to support the promised revolution.
Key Takeaways
- US EV growth crashed 75%: From 40% year-over-year in 2023 to 10% in 2024, with penetration flatlined at 7-8% for four consecutive quarters.
- BloombergNEF reversed course: First-ever downward revision cut 14 million vehicles from 2030 projections, directly blaming US policy rollbacks.
- Federal tax credits are gone: Expired September 30, 2025. Princeton projects 30% sales drop by 2027, 40% by 2030 without them.
- Infrastructure costs are massive: $250,000-$300,000 per charging site, plus billions in grid upgrades. California needs $6-20 billion by 2045.
- China dominates while America stalls: 50% penetration and 60% global market share versus US 7-8% stagnation.
- Developer opportunities shift: Focus on grid optimization and efficiency tools rather than growth-dependent charging networks. Market uncertainty favors pragmatic infrastructure plays over hype-driven expansion.

