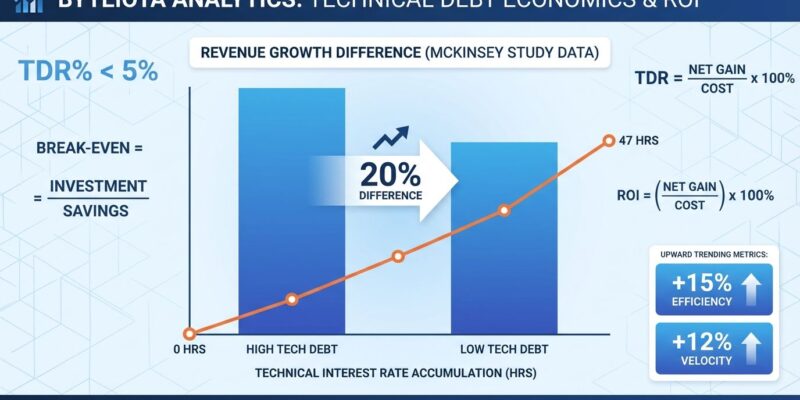
Engineering teams constantly face the “features vs. refactoring” debate, but most lack quantitative data to make this decision. A new economic framework published in January 2026 transforms technical debt from a vague concern into measurable business impact. McKinsey’s analysis of 220 companies revealed companies in the 80th percentile for Tech Debt Score achieve 20% higher revenue growth than those in the bottom 20th percentile—hard data connecting code quality to business performance.
Technical Debt Compounds Like Financial Debt
Technical debt isn’t just a metaphor—it accumulates real interest through ongoing productivity costs. Consider a rushed authentication module that initially saved 80 hours (two weeks of development time). The shortcuts seemed worth it at the time. However, the “interest” starts accruing immediately.
The friction costs add up fast. Month 1: 3 hours debugging authentication issues. Month 3: 8 hours implementing security fixes. Month 6: 20 hours adding OAuth integration to the messy codebase. Month 12: 16 hours onboarding a new developer who struggles to understand the convoluted logic. By the end of Year 1, that initial 80-hour “savings” has accumulated 47 hours in friction costs—reducing the effective savings to just 33 hours (a 41% erosion). By Year 2, the interest typically exceeds the principal.
This is the “technical interest rate” in action—a concept introduced in a January 2026 analysis applying market theory to code quality decisions. The framework treats software development as an economic system with measurable dynamics: supply and demand forces, interest accumulation, speculation bubbles, and market corrections. That hastily written module before a deadline? That’s a speculation bubble. The forced six-month refactoring project when everything breaks? That’s the market correction.
Calculating Refactoring ROI: The Break-Even Formula
Here’s where it gets practical. Engineering leaders can now calculate when refactoring pays off using break-even analysis. If a two-week refactoring (80 developer hours) eliminates 5 hours of monthly friction, the break-even point is 16 months. Everything beyond that represents pure productivity gains.
Let’s put dollar values on this. At a $150K annual developer salary (approximately $75 per hour), eliminating 5 hours of monthly friction equals $375 per month, or $4,500 annually per affected developer. For a 10-developer team, that’s $45,000 per year in productivity gains—indefinitely, as long as the refactored code remains in use.
This calculation template is immediately actionable. Estimate your refactoring cost in hours. Measure the recurring friction cost you’ll eliminate (time spent debugging, working around issues, explaining complexity to new team members). Divide refactoring cost by monthly friction savings to get your break-even timeline. If the payback period is reasonable (typically 12-24 months for infrastructure code), you have a data-driven business case.
The framework reframes refactoring from “gold-plating” to strategic investment with quantifiable returns. No more subjective arguments about code quality—just ROI projections using the same financial language applied to any other business investment.
The Business Case: 20% Higher Revenue Growth
McKinsey’s research provides the strongest business justification for managing technical debt. Their Tech Debt Score (TDS) analysis of 220 organizations across multiple business sectors revealed companies with lower technical debt consistently outperform their peers. The numbers are stark: companies in the 80th percentile for TDS have revenue growth 20% higher than those in the bottom 20th percentile, and 10% higher than average.
The scale of the problem is substantial. CIOs estimate technical debt amounts to 20-40% of their entire technology estate value (before depreciation). Moreover, approximately 30% of budgets ostensibly dedicated to “new products” gets diverted to resolving issues related to tech debt. That’s not building new features—that’s paying compound interest on old shortcuts.
This isn’t anecdotal evidence from a single company. This is peer-comparison data from 220 organizations demonstrating a measurable correlation between code quality and business performance. When presenting to CFOs, boards, or investors, this data transforms the conversation from “engineers want clean code” to “companies with lower technical debt achieve measurably higher revenue growth.”
Related: Platform Engineering ROI in 2026: Business Metrics Win
Measurement Metrics and Prioritization Framework
Monday.com’s 2026 strategic guide identifies three essential metrics for tracking technical debt impact. First, code complexity metrics: cyclomatic complexity, code duplication rates, and maintainability scores. These can be measured automatically using tools like SonarQube or CodeClimate. Second, velocity impact analysis: compare delivery times in high-debt versus low-debt areas of your codebase to quantify the slowdown. Third, maintenance cost tracking: measure the percentage of developer time spent on bugs and refactoring versus new features.
The Tech Debt Ratio (TDR) provides concrete benchmarks. Calculate it as estimated remediation effort divided by total development effort. Teams with TDR below 5% maintain healthy velocity. Teams between 5-20% show acceptable but declining velocity. Teams above 20% face systemic issues requiring strategic intervention. Industry data shows developers spend an average of 23% of their time on technical debt—that’s more than one day per week.
Prioritization matters as much as measurement. The 80/20 rule applies: a small portion of your codebase is responsible for the bulk of system issues. Instead of prioritizing by code age or vague “business value” assessments, focus on code change frequency (high-churn areas have higher interest rates), operational risk (what breaks when this fails), and quantifiable maintenance costs. Academic research shows only 3 papers on technical debt prioritization use business-related constraints—highlighting the gap this economic framework fills.
As Stack Overflow emphasizes: “If you want to address tech debt, quantify it first. The amount of time that a team spends on non-feature code is a metric you can hang a budget on.” Track your team’s time allocation with ticket tracking discipline, estimate story points for debt work, and prove the hours spent maintaining versus building.
Key Takeaways
- Technical debt has a measurable interest rate: The authentication module example shows how 80 hours of initial savings erode to 33 hours in Year 1 through accumulated friction costs, with interest exceeding principal by Year 2.
- Refactoring ROI is calculable: Use break-even analysis—if a 2-week refactoring eliminates 5 hours of monthly friction, you break even at 16 months with $45K annual productivity gains for a 10-developer team.
- Code quality correlates with revenue growth: McKinsey’s 220-company study reveals companies in the 80th percentile for Tech Debt Score achieve 20% higher revenue growth than bottom performers—hard data for business stakeholders.
- Track TDR, not just velocity: Tech Debt Ratio below 5% maintains healthy velocity, 5-20% shows decline, above 20% signals systemic issues. Combine with velocity impact analysis and maintenance cost tracking for complete picture.
- Prioritize by friction cost, not age: Focus on high-change-frequency code with measurable operational risk rather than “oldest code first”—apply the 80/20 rule to focus limited refactoring resources on highest-ROI improvements.
The economic framework transforms technical debt discussions from subjective preferences to data-driven investment decisions. Engineering leaders can now speak the language of business stakeholders—ROI, break-even analysis, and revenue impact—when justifying code quality work. Tools like SonarQube and CodeClimate automate the measurement, tracking TDR in CI/CD pipelines and enforcing quality gates before deployment. The question isn’t whether to address technical debt, but which debt delivers the highest ROI when addressed.