Platform engineering is entering its “prove it or lose it” phase in 2026. After Gartner’s prediction that 80% of software engineering organizations will have platform teams by 2026—up from 45% in 2022—the hype has given way to hard questions from finance teams: What’s the ROI? According to platformengineering.org’s 2026 predictions, successful platform teams must now “measure and communicate ROI in business terms: revenue enabled, costs avoided, and profit center contribution,” not just DevOps metrics like deployment frequency. Platform teams that can’t translate engineering velocity into business value will face budget cuts in annual planning cycles.
Why DORA Metrics Can’t Save Your Platform Budget
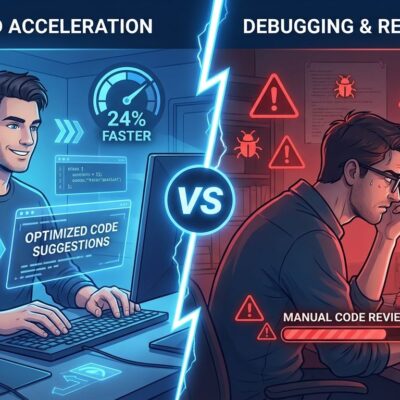
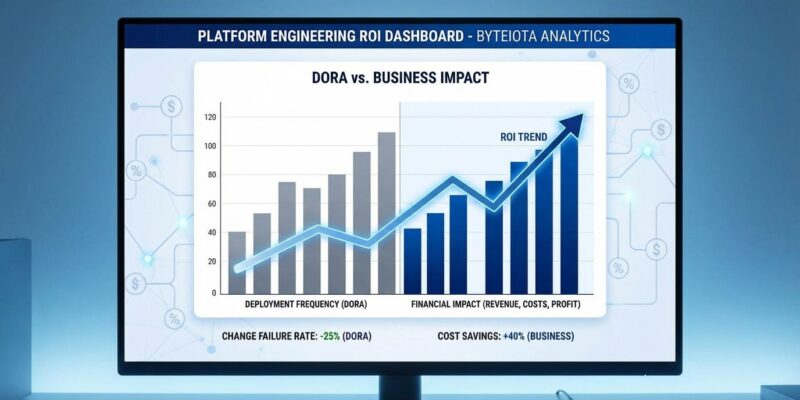
DORA metrics—deployment frequency, lead time, mean time to restore, change failure rate—measure how fast teams ship code. They don’t measure whether what you’re shipping creates business value. Present cycle time improvements or deployment frequency gains to a CFO, and you’ll get blank stares. These are engineering metrics, and non-technical executives don’t understand how “40% faster deployments” helps reach quarterly revenue targets.
Platform engineering expert Hazel Weakly argues that “DORA metrics are useful for self-reflection and self-improvement; you want them, but you shouldn’t be graded on them.” The core limitation: DORA tells you how fast you’re moving, not whether you’re moving in the right direction. A platform team can achieve elite DORA scores while the company misses its business goals entirely.
Moreover, DORA ignores platform-specific work. Spend six weeks standardizing security configurations across teams? Reduce tech debt that would cause production incidents next quarter? Improve developer experience so engineers don’t burn out? None of this affects deployment frequency or lead time. Tech debt is invisible to DORA metrics unless it causes failed releases—which means DORA only catches problems after they explode.
Related: Developer Productivity Metrics Crisis: Why 66% Don’t Trust The Data
Revenue, Costs, Profit: The New Platform Engineering ROI Language
By 2026, platform teams need to communicate value using three business pillars. Revenue Enabled: how platforms accelerate time-to-market and create competitive advantage. Costs Avoided: infrastructure savings, reduced incident response, optimized cloud spend. Profit Center Contribution: positioning platforms as strategic assets that generate value, not just reduce overhead.
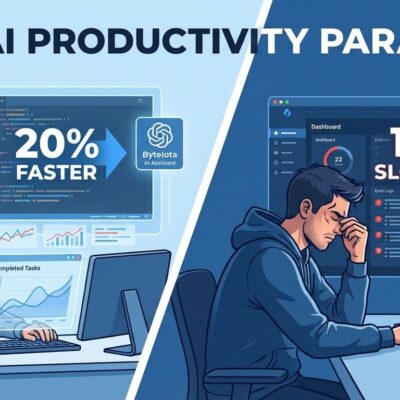
Real-world benchmarks show what this looks like. High-maturity platform teams report 40-50% developer productivity gains—developers spend less time fighting infrastructure, more time building revenue-generating features. A Forrester 2024 study found 20-30% infrastructure cost reductions and 40% deployment frequency improvements. Furthermore, organizations implementing DX Core 4 metrics (combining DORA, SPACE, and DevEx frameworks) achieve up to 12% engineering efficiency improvements with 15% employee engagement boosts across 300+ companies.
One 25-developer startup deployed a lightweight platform and saw results within six weeks: 3x improvement in developer autonomy, 40% faster lead times. This is the translation layer executives need. Instead of “MTTR reduced by 30 minutes,” say “incident response saved $X annually in recovered engineering hours.” Instead of “lead time improved 40%,” say “time-to-market acceleration enabled $Y in competitive revenue capture.”
The $X Formula: How One DXI Point Equals Real Dollars
The Developer Experience Index (DXI) is the first validated productivity measure that directly ties to dollar amounts. Built on research from 40,000+ developers across 800 organizations, DXI shows that each one-point gain in score translates to saving 13 minutes per week per developer—equivalent to 10 hours annually. This creates a direct financial calculation: improved developer experience equals measurable cost savings.
Organizations with top-quartile DXI scores demonstrate engineering speed and quality 4-5 times higher than bottom-quartile teams, with 43% higher employee engagement. The framework measures 14 actionable dimensions—deep work, local iteration speed, release process, confidence in making changes—and combines them into a single score CFOs can understand.
The math is straightforward. Your platform increased DXI by 5 points across 50 developers. Consequently, that’s 5 points times 13 minutes per week equals 65 minutes per week saved per developer. Multiply by 50 developers, convert to annual hours (2,700), apply loaded developer cost—and you have a concrete dollar figure for platform ROI. This is the proof executives demand, in language finance teams speak.
Why 6 Metrics Beat 1: The Platform Measurement Sweet Spot
Research shows that platform teams measuring a single metric have a one-in-three chance of success. Two metrics? Fifty-fifty odds. Organizations measuring six or more metrics across multiple dimensions are most likely to build successful platforms. The optimal approach combines DORA (engineering velocity), SPACE (developer satisfaction and efficiency), DX Core 4 (business impact), and FinOps metrics (cost optimization).
The multi-framework approach addresses blind spots. DORA measures velocity but misses developer happiness. SPACE captures satisfaction but doesn’t tie to revenue. DX Core 4 adds business impact but needs FinOps integration for cost visibility. By measuring six or more dimensions, platforms capture the full picture: Are we shipping fast? Are developers happy? Is this creating business value? Are we optimizing costs?
This prevents the “optimizing for the wrong thing” trap. Measure only DORA, and teams game deployment frequency while developer morale tanks. Measure only satisfaction, and platforms become expensive without demonstrating business impact. However, six metrics create accountability across dimensions—velocity, quality, experience, and business value. It’s comprehensive proof, not cherry-picked stats.
Related: Cloud Waste 2026: $225B Lost, FinOps Automation Needed
From Cost Center to Cost Cop: Preventive FinOps in 2026
Platform engineering is merging with FinOps (financial operations for cloud spend) in 2026. The shift: from reactive cost dashboards showing spend after it happens, to preventive cost gates that block deployments exceeding unit-economic thresholds before they reach production. Cloud costs are often the second-largest expense after salaries. Platforms are now responsible for enforcing financial discipline.
Platform teams are implementing pre-deployment cost checks. Services that would exceed per-request cost thresholds, per-user infrastructure costs, or monthly budget caps get rejected before deployment. Therefore, this turns platforms from passive infrastructure providers into active financial governance layers. Set a threshold like “no service can cost more than $0.50 per 1,000 API calls.” If a developer’s code would breach that limit, the platform blocks deployment and suggests optimizations.
This directly addresses the “Costs Avoided” ROI pillar. Platforms can now report: “Prevented $X in wasteful cloud spend by enforcing unit-economic thresholds.” Consequently, this turns platforms from cost centers (we spend $Y on platform team salaries) into profit protectors (we saved $X by preventing waste, netting $Z value). It aligns with CFO priorities: predictable costs, no budget overruns, financial accountability baked into engineering workflows.
The 2026 Timeline: Prove Platform Engineering ROI or Lose Funding
Platform engineering has reached mainstream adoption. Gartner’s 80% prediction means platforms are no longer special engineering initiatives—they’re subject to the same business scrutiny as any other organizational investment. The 2026 annual planning cycles are the first time platform teams at scale must justify ROI to finance leaders who view platforms as just another line item.
The adoption trajectory tells the story: 45% in 2022 (competitive advantage, early adopters), 55% in 2025 (majority adoption, “everyone’s doing it”), 80% by 2026 (table stakes, no longer innovative). When something shifts from innovation to commodity, the question changes from “what can this do?” to “what does it cost?” This is platform engineering’s transition from hype cycle to business justification phase.
Platform teams can’t wait another two years to figure out ROI measurement. They need frameworks—DXI, DX Core 4, FinOps integration—and data demonstrating revenue enabled, costs avoided, and profit contribution right now for Q1 2026 budget discussions. The “prove it or lose it” framing isn’t hyperbole. It’s the reality of platform engineering’s maturity phase.
Key Takeaways
- DORA metrics measure engineering velocity, not business value—executives need to understand revenue enabled, costs avoided, and profit contribution instead of deployment frequency and MTTR
- The Developer Experience Index (DXI) provides the first validated productivity measure with direct financial linkage: 1 DXI point = 13 minutes per week saved per developer = quantifiable dollar impact
- Platform teams measuring 6+ metrics across DORA, SPACE, DX Core 4, and FinOps frameworks are most likely to succeed—single metrics create a one-in-three success rate
- FinOps integration transforms platforms from cost centers to profit protectors by implementing pre-deployment cost gates that prevent wasteful cloud spend before it happens
- 2026 is platform engineering’s “prove it or lose it” year—with 80% adoption predicted, teams must demonstrate business ROI in Q1 budget planning or risk losing funding