Developers using AI coding tools take 19% longer to complete tasks but believe they’re 20% faster. This 39-percentage-point perception gap, revealed in METR’s 2025 study of experienced developers, exposes a fundamental crisis in how we measure software productivity. While 84% of developers now use AI assistants, 66% don’t trust the metrics measuring their performance. GitClear’s analysis of 211 million lines of code found code churn doubled, and Uplevel Data Labs reported 41% higher bug rates with AI—yet teams continue optimizing based on flawed measurements.
Companies are making critical decisions about hiring, compensation, and tool adoption based on productivity data that’s systematically wrong in the AI era.
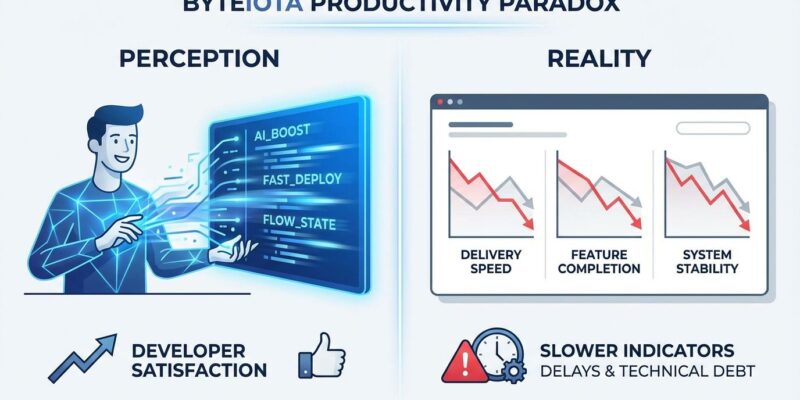
Developers Are 19% Slower But Feel 20% Faster
METR’s randomized controlled trial recruited 16 experienced developers from major open-source repositories averaging 22,000 stars and over a million lines of code. Researchers randomly assigned 246 issues to either allow or prohibit AI tool usage, then tracked completion times via screen recordings and self-reports. The study ran from February through June 2025, with participants primarily using Cursor Pro with Claude 3.5 and 3.7 Sonnet.
The results were striking. Developers expected a 24% speedup before the study began. After experiencing the actual 19% slowdown, they still believed AI had accelerated them by 20%. The 39-percentage-point gap between perception and reality reveals a cognitive blindspot: seeing code appear on screen feels like productivity, regardless of actual delivery speed.
Time allocation shifted dramatically with AI. Developers spent less time actively coding and searching documentation, but more time prompting AI, waiting on responses, reviewing AI-generated output, and sitting idle. The net result: tasks took longer to complete, not shorter. Moreover, METR researchers found the slowdown most pronounced on familiar codebases where developers had high prior exposure—precisely the scenarios where experienced engineers should excel.
The lesson is stark. If developers can misjudge their own performance by 39 percentage points, self-reported productivity gains are worthless. The entire AI productivity narrative rests on measurements that systematically mislead.
Code Quality Is Collapsing (And Traditional Metrics Miss It)
GitClear analyzed 211 million changed lines from repositories owned by Google, Microsoft, Meta, and enterprise corporations between 2020 and 2024. Code churn—the percentage of lines revised or updated within two weeks of authoring—climbed from 5.5% in 2020 to 7.9% in 2024, a 43% increase. AI-generated code showed 41% higher churn rates compared to human-written code.
Copy-pasted code rose from 8.3% of changed lines in 2021 to 12.3% in 2024, a 48% jump. Code blocks with five or more duplicates increased eightfold in 2024 alone. Meanwhile, refactoring—the practice of improving code structure without changing functionality—plummeted from 25% of changed lines in 2021 to less than 10% in 2024.
Uplevel Data Labs studied 800 developers split into test and control groups to measure GitHub Copilot’s impact. Bug rates increased 41% for developers with Copilot access. PR cycle time showed zero improvement. Throughput showed zero improvement. Even burnout mitigation failed: developers without Copilot reduced burnout risk by 28%, while those with Copilot managed only 17%.
Traditional velocity metrics can look excellent while code quality disintegrates. Teams celebrate “98% more PRs merged” without tracking that churn doubled, bugs increased 41%, and refactoring collapsed 60%. Output metrics reward volume. Outcome metrics reveal the cost.
66% Don’t Trust the Metrics Measuring Them
JetBrains surveyed 24,534 developers for their 2025 State of Developer Ecosystem report. The trust crisis is quantified: 66% of developers don’t believe current productivity metrics reflect their true contributions. Despite this distrust, companies continue using these same metrics for performance reviews, compensation decisions, and resource allocation.
Developers increasingly recognize that non-technical factors matter as much as technical ones. 62% cited collaboration, communication, and clarity as critical to their performance, compared to 51% who emphasized technical factors like faster CI pipelines or better IDEs. The shift signals that productivity frameworks measuring only code output miss half the picture.
Meanwhile, only 29% of developers trust AI accuracy, according to Stack Overflow’s 2025 survey. This creates a compounding problem: unreliable tools measured by unreliable metrics, with both generating positive-looking numbers that mask actual slowdowns. The double illusion reinforces itself—flawed measurements validate questionable productivity claims, which justify continued investment in tools that may be slowing teams down.
When McKinsey published its developer productivity framework, the industry pushed back hard. Dave Farley, co-author of Continuous Delivery, called everything beyond DORA metrics “pretty much astrology.” Kent Beck dismissed McKinsey’s approach as “absurd and naive.” Gergely Orosz collaborated with Beck on a detailed response arguing McKinsey’s framework “only measures effort or output, not outcomes and impact.” The controversy revealed a fundamental divide: consultants optimizing for measurable activity versus practitioners demanding outcome-based assessment.
The Review Bottleneck: Where Productivity Gains Evaporate
AI shifted the constraint from coding to code review. Research shows PR review times increase 91% when developers use AI tools, even as teams merge 98% more pull requests. The capacity mismatch is straightforward: generating features in two hours means nothing if reviews take four hours. The bottleneck moved, and teams didn’t adjust.
At large companies, the median engineer waits 13 hours for PR reviews. This wait time exists despite AI supposedly accelerating development. The explanation is systemic: AI accelerates individual coding speed, but review capacity remains fixed. One developer generating twice the code requires twice the review time from senior engineers, whose bandwidth hasn’t doubled. The result is a traffic jam.
Worklytics analyzed 6.1 million pull requests across 3,000 teams for their 2025 benchmarks. Median lead time is 3.8 days, with high-performing teams maintaining sub-two-day lead times. The gap often comes down to review speed, not coding speed. Focus hours tell a similar story: median teams achieve 4.2 hours of uninterrupted work daily, while elite teams reach 6.5 hours. AI prompting creates cognitive load and interruptions, reducing focus time precisely when quality review demands more of it.
The classic systems thinking error: optimize one constraint without considering downstream effects. Teams widened the highway but kept toll booths the same size. Throughput didn’t increase. Traffic just backed up somewhere new.
Measure Outcomes, Not Output: The DevEx Shift
Nicole Forsgren, creator of DORA metrics, now argues “most productivity metrics are a lie.” She advocates measuring developer experience through three components: flow state, cognitive load, and feedback loops. Flow state asks whether developers can enter deep concentration without interruption. Cognitive load examines mental burden from context switching and tool friction. Feedback loops track how quickly developers receive quality signals about their work.
DORA metrics—deployment frequency, lead time, change failure rate, and mean time to recovery—capture system-level performance but don’t explain why performance changes. When deployment frequency increases but code quality drops, DORA shows the first gain without revealing the second cost. The 2025 DORA Report acknowledges AI acts as an “amplifier” rather than a universal solution, magnifying both organizational strengths and weaknesses.
Industry frameworks are converging toward hybrid approaches. The “Core 4” strategy combines DORA delivery metrics with DevEx insights, code quality perceptions, and business impact measurements. Companies that measure only velocity or throughput optimize for activity. Companies that measure outcomes—features shipped, user value delivered, defect resolution time—optimize for results.
The benchmarks reveal what matters. Elite teams don’t just ship more code. They maintain 6.5+ focus hours daily compared to the 4.2-hour median. They keep lead times under two days while median teams average 3.8 days. They protect uninterrupted work time, minimize context switches, and shorten feedback loops. These aren’t output metrics. They’re enablers of sustainable, high-quality delivery.
Key Takeaways
- Developers misjudge their own AI productivity by 39 percentage points—taking 19% longer while believing they’re 20% faster exposes a systematic measurement failure across the industry.
- Code quality degrades measurably with AI: churn doubled (5.5% to 7.9%), bugs increased 41%, refactoring collapsed 60%, yet traditional velocity metrics show improvement.
- 66% of developers don’t trust current productivity metrics, and only 29% trust AI accuracy—flawed tools measured by flawed metrics create a compounding illusion of progress.
- Review bottlenecks (+91% wait time) nullify coding speed gains (+98% PRs merged) because teams optimized one constraint without scaling downstream capacity.
- Measure outcomes (value delivered, user impact) not outputs (PRs merged, lines of code)—the shift from DORA to DevEx frameworks focuses on flow state, cognitive load, and feedback loops instead of activity metrics.