Go was the last holdout. Java developers have been attaching OpenTelemetry agents at startup for years. Python, Node.js, .NET — all of them have had zero-code instrumentation that works without touching source. Go could not do this, because a Go binary is a single static artifact with no runtime to hook into. The OpenTelemetry project shipped a workaround in the form of eBPF agents, but those only see network-level events, require Linux, and tell you nothing about what your application is actually doing inside. On July 23, the OpenTelemetry project shipped v1 of otelc — a compile-time instrumentation tool that closes the gap for good.
What otelc Does
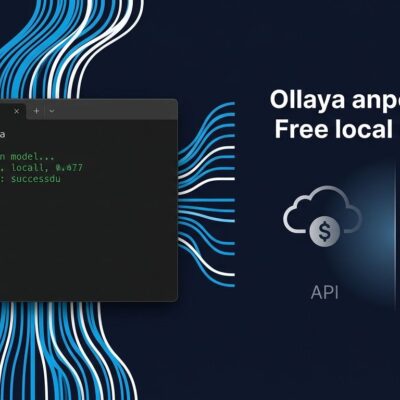
otelc is a command-line tool that wraps the standard Go toolchain. Instead of running go build, you run otelc go build. Everything after go passes through unchanged to the regular compiler. What otelc adds is an AST transformation step: it parses your source and your dependencies, injects OTel span creation and context propagation at the right call sites, and hands the modified AST off to the Go compiler. The resulting binary is instrumented. No source files are modified. No runtime agent runs alongside your process.
The project is vendor-neutral (Apache 2.0), driven by Alibaba Cloud Observability, Datadog, Cabify, and a community SIG that has been developing since early 2025. v1 means stable CLI API — production-ready, not a preview. The source is on GitHub.
What Gets Instrumented Automatically
At v1, otelc auto-instruments the following libraries when it finds them in your module — no configuration required:
- net/http — HTTP server and client spans with method, URL, and status code
- database/sql — database query spans for all drivers (Postgres, MySQL, SQLite) including query text
- google.golang.org/grpc — gRPC client and server calls with method names
- github.com/segmentio/kafka-go — Kafka producer and consumer spans with topic and offset
- github.com/redis/go-redis — Redis command spans
- log/slog — automatic log-to-trace correlation so your structured logs include the active trace ID
- Go runtime metrics — goroutine count, GC pause duration, heap memory, exported via OTLP
otelc discovers supported libraries by scanning your module graph. If a library has a rule file, it gets instrumented. If not, it passes through untouched. No explicit configuration list required.
How to Add It to Your Build
Install the CLI:
go install go.opentelemetry.io/compile-instrumentation/cmd/otelc@latestBuild with instrumentation:
OTEL_EXPORTER_OTLP_ENDPOINT=http://localhost:4317 otelc go build ./...In a Dockerfile, it is a one-line swap:
# Before
RUN go build -o /app ./...

# After
RUN otelc go build -o /app ./...
Point OTEL_EXPORTER_OTLP_ENDPOINT at any compatible backend — Jaeger, Grafana Tempo, Honeycomb, Datadog, Dynatrace. The binary handles the export; your container does not need a sidecar.
otelc vs eBPF: Pick the Right Tool
We covered the eBPF-based OTel OBI approach earlier this month. The two tools are not competing — they solve different problems.
| otelc (compile-time) | eBPF (OBI) | |
|---|---|---|
| Code changes required? | No | No |
| Linux only? | No (any OS) | Yes |
| Application-level detail? | Yes (spans, query text, Kafka topic) | No (network traffic only) |
| Rebuild required? | Yes | No |
Use otelc when you want full distributed traces with application context and you control the build. Use eBPF when you want infrastructure-level visibility without touching your build pipeline at all. They compose: run both to get network-level and application-level telemetry simultaneously.
What otelc Does Not Cover Yet
Know the current scope before shipping to production. v1 supports the libraries listed above — popular Go HTTP frameworks like Gin, Echo, and Gorilla Mux are on the v1.1 roadmap but not stable yet. GORM is also missing. If your service uses these, you will need manual OTel spans for those layers until community instrumentation rules land.
The CLI is stable. The programmatic API for writing custom instrumentation rules is pre-stable — do not build tooling on top of it until v1.1.
Why This Matters Beyond Go
OpenTelemetry’s zero-code story is now complete. Every major language — Java, Python, Node.js, .NET, Ruby, PHP, and now Go — has a path to distributed tracing without touching source code. This closes the last argument against adopting OTel as the default observability layer in polyglot microservice architectures.
For teams running Go services alongside instrumented services in other languages, otelc means those Go services can finally participate in the same distributed trace without a manual instrumentation sprint. That has been the missing piece for years. The official getting started guide walks through the full setup in about ten minutes.