OpenObserve crossed 20,000 GitHub stars this week, backed by 8,000+ production deployments — including Fortune 100 companies ingesting 2.5 petabytes of telemetry daily. The milestone arrives three months after a $10 million Series A from Nexus Venture Partners and Dell Technologies Capital. The value proposition has not changed: one Rust binary replaces your entire Elasticsearch-Loki-Prometheus-Tempo stack and cuts storage costs by up to 140x. Now it also monitors your LLMs.
The 140x Claim — What’s Real
Marketing numbers deserve skepticism. Here is what the benchmark actually shows: in a 1.1 TB log ingestion test against Elasticsearch, OpenObserve compressed data 9.5x better, ran at 15% CPU, and cost 87x less on storage. The headline “140x” comes from comparisons against unoptimized Elasticsearch deployments without compression tuning. In honest apples-to-apples terms, 87x is still not a rounding error.
Against Datadog, the gap is even starker in dollar terms. One production comparison logged Datadog at $174 per day versus OpenObserve at $3 per day for identical workloads. The structural reason: Datadog charges per host, then charges again separately for APM, again for logs, again for RUM, and again for metrics. OpenObserve bundles all four under flat $0.30/GB pricing. You stop paying for the product taxonomy and start paying for data volume.
Why the Architecture Wins
Traditional log stacks use row-based storage. When you write a log line, every field lands in the same row, and querying a single field requires scanning all of them. OpenObserve stores data in Apache Parquet — a columnar format designed for analytical queries. Pull the “level” field across ten million log lines and you read only the column you asked for, compressed at 40x. This is why its query engine (DataFusion, running SQL directly on Parquet) wins 14 out of 15 benchmark queries against Elasticsearch, with 32x faster aggregations.
The ops story matters as much as the performance story. ELK is not technically free — you pay with engineering time. Elasticsearch clusters require tuning, Logstash needs its own infra, and Kibana is a third system to maintain. OpenObserve ships as a single binary. Get it running with one Docker command:
docker run -d -p 5080:5080 \
  -v openobserve_data:/data \
  -e ZO_ROOT_USER_EMAIL=admin@example.com \
  -e ZO_ROOT_USER_PASSWORD=ChangeMe123! \
  openobserve/openobserve:latest
The UI comes up at localhost:5080 in under two minutes. For production scale, OpenObserve distributes across Router, Ingester, Compactor, and Querier nodes — all pointing at the same S3-compatible object store. No expensive local NVMe for hot storage required. Full quick-start documentation is available on the official site.
The LLM Observability Angle
This is the part that makes OpenObserve relevant beyond the cost-savings crowd. In 2026, teams running AI agents have a new class of observability problem: not just “is the service up” but “how many tokens did that tool call burn and what did it cost.” OpenTelemetry added gen_ai semantic conventions specifically for this — recording input and output token counts as span attributes alongside model ID, latency, and error state.
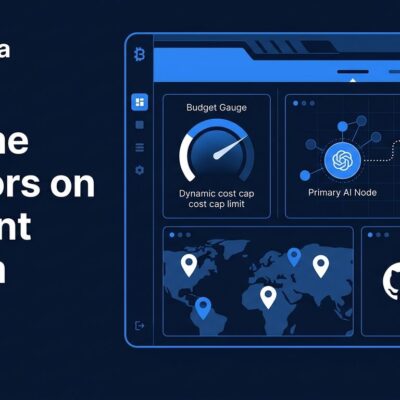
OpenObserve supports these conventions natively. You get token-level tracing, real-time cost dashboards per model and team, LLM call chains visualized as directed acyclic graphs, and anomaly detection on latency and error rates — all in the same interface as your Kubernetes logs and infrastructure metrics. Langfuse and Helicone are purpose-built LLM observability tools and both are excellent. Neither shows you what your Kubernetes node was doing when the LLM call timed out. OpenObserve does.
The AI SRE agent, launched in April alongside the Series A, correlates signals across infrastructure, application, and LLM telemetry and flags root causes before engineers start digging manually.
Who Is Actually Running It
The 20,000 star count matters less than the 8,000 production deployments. GitHub stars are easy to accumulate; production deployments at petabyte scale are not. OpenObserve is not a weekend experiment that went viral — it has been growing steadily for over two years. The Fortune 100 customers running 2.5 PB/day ingestion are not doing that on a whim. The GitHub repository reflects real adoption across 8,000+ organizations.
The Series A investors’ decision to preemptively fund the round — both Nexus Venture Partners and Dell Technologies Capital had participated in the seed — signals enterprise trajectory, not just open-source community buzz.
Should You Switch Now?
If you are on the ELK stack and your observability bill is a recurring pain point, the answer is yes — with one caveat. OpenObserve’s ecosystem maturity is not Elasticsearch’s. The Elasticsearch plugin ecosystem is enormous. OpenObserve integrates via OpenTelemetry Collector, Fluent Bit, and a direct HTTP API, which covers most real-world ingestion needs, but you may hit edge cases if you depend on obscure Beats inputs.
If you are on Datadog and spending $50K+ per year, the cost argument is hard to ignore. The migration path is not zero-effort, but the operational profile of a single binary pointed at S3 is dramatically simpler than what most teams replaced Datadog with previously.
If you are building AI-native infrastructure in 2026 and do not yet have an LLM observability layer, starting with OpenObserve now means you get infrastructure and LLM monitoring in one setup instead of two.